Immigrants from Kazakhstan vs Immigrants from Guatemala Median Male Earnings
COMPARE
Immigrants from Kazakhstan
Immigrants from Guatemala
Median Male Earnings
Median Male Earnings Comparison
Immigrants from Kazakhstan
Immigrants from Guatemala
$59,278
MEDIAN MALE EARNINGS
99.1/ 100
METRIC RATING
92nd/ 347
METRIC RANK
$46,244
MEDIAN MALE EARNINGS
0.0/ 100
METRIC RATING
315th/ 347
METRIC RANK
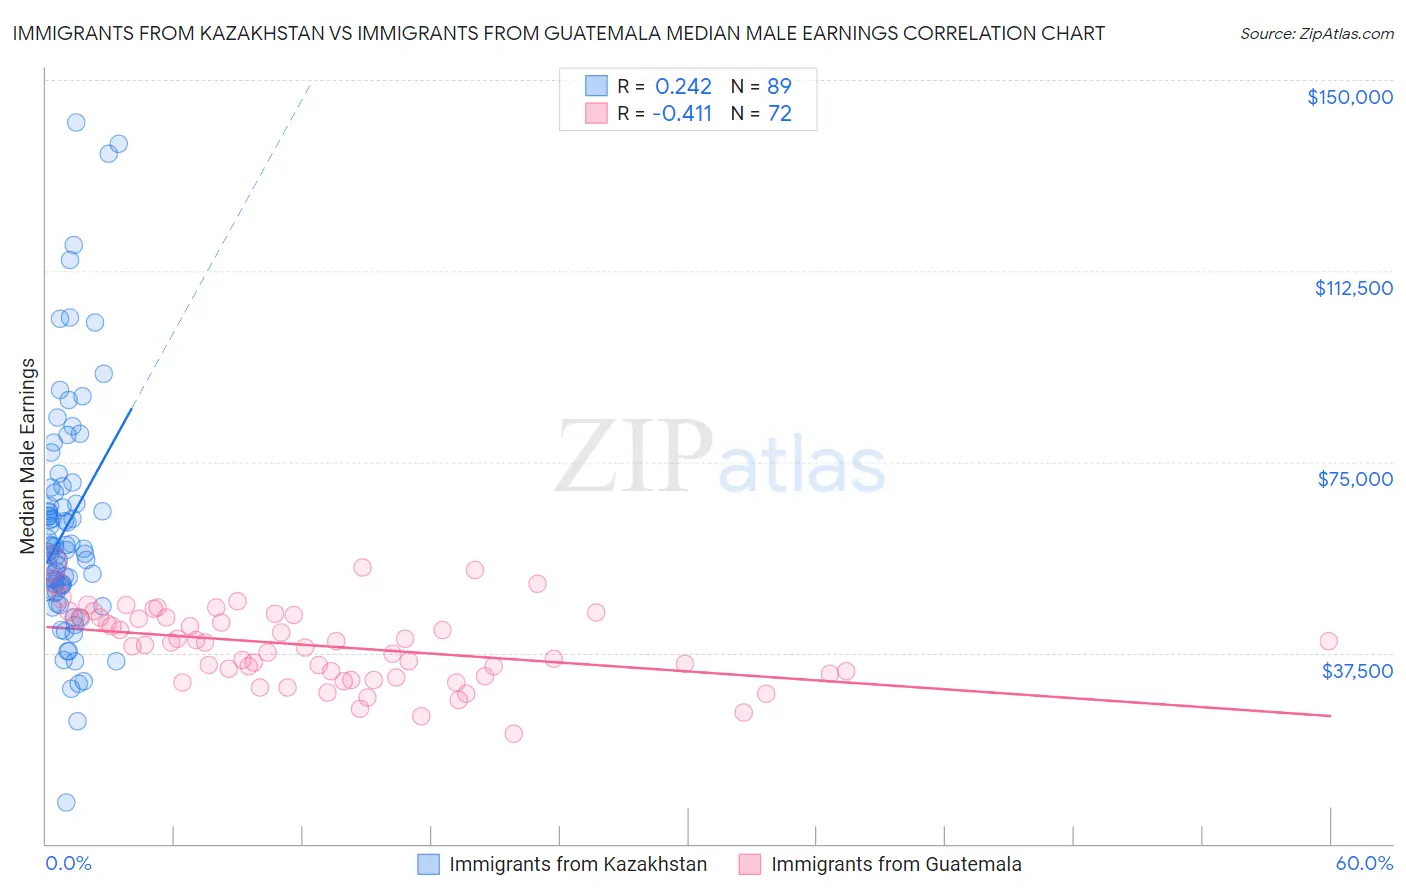
Immigrants from Kazakhstan vs Immigrants from Guatemala Median Male Earnings Correlation Chart
The statistical analysis conducted on geographies consisting of 124,430,044 people shows a weak positive correlation between the proportion of Immigrants from Kazakhstan and median male earnings in the United States with a correlation coefficient (R) of 0.242 and weighted average of $59,278. Similarly, the statistical analysis conducted on geographies consisting of 377,185,627 people shows a moderate negative correlation between the proportion of Immigrants from Guatemala and median male earnings in the United States with a correlation coefficient (R) of -0.411 and weighted average of $46,244, a difference of 28.2%.
Median Male Earnings Correlation Summary
| Measurement | Immigrants from Kazakhstan | Immigrants from Guatemala |
| Minimum | $8,214 | $21,641 |
| Maximum | $141,534 | $55,102 |
| Range | $133,320 | $33,461 |
| Mean | $62,279 | $38,841 |
| Median | $57,775 | $39,223 |
| Interquartile 25% (IQ1) | $49,614 | $33,223 |
| Interquartile 75% (IQ3) | $69,378 | $44,533 |
| Interquartile Range (IQR) | $19,764 | $11,310 |
| Standard Deviation (Sample) | $23,727 | $7,423 |
| Standard Deviation (Population) | $23,593 | $7,371 |
Similar Demographics by Median Male Earnings
Demographics Similar to Immigrants from Kazakhstan by Median Male Earnings
In terms of median male earnings, the demographic groups most similar to Immigrants from Kazakhstan are Immigrants from Southern Europe ($59,217, a difference of 0.10%), Laotian ($59,351, a difference of 0.12%), Austrian ($59,359, a difference of 0.14%), Immigrants from North Macedonia ($59,189, a difference of 0.15%), and Immigrants from Moldova ($59,417, a difference of 0.24%).
| Demographics | Rating | Rank | Median Male Earnings |
| Italians | 99.3 /100 | #85 | Exceptional $59,551 |
| Immigrants | England | 99.3 /100 | #86 | Exceptional $59,527 |
| Macedonians | 99.3 /100 | #87 | Exceptional $59,522 |
| Immigrants | Argentina | 99.3 /100 | #88 | Exceptional $59,491 |
| Immigrants | Moldova | 99.2 /100 | #89 | Exceptional $59,417 |
| Austrians | 99.2 /100 | #90 | Exceptional $59,359 |
| Laotians | 99.2 /100 | #91 | Exceptional $59,351 |
| Immigrants | Kazakhstan | 99.1 /100 | #92 | Exceptional $59,278 |
| Immigrants | Southern Europe | 99.0 /100 | #93 | Exceptional $59,217 |
| Immigrants | North Macedonia | 99.0 /100 | #94 | Exceptional $59,189 |
| Immigrants | Lebanon | 98.6 /100 | #95 | Exceptional $58,835 |
| Albanians | 98.4 /100 | #96 | Exceptional $58,680 |
| Northern Europeans | 98.2 /100 | #97 | Exceptional $58,588 |
| Jordanians | 98.1 /100 | #98 | Exceptional $58,500 |
| Immigrants | Poland | 98.0 /100 | #99 | Exceptional $58,452 |
Demographics Similar to Immigrants from Guatemala by Median Male Earnings
In terms of median male earnings, the demographic groups most similar to Immigrants from Guatemala are Immigrants from Caribbean ($46,193, a difference of 0.11%), Mexican ($46,147, a difference of 0.21%), Chippewa ($46,368, a difference of 0.27%), Honduran ($46,374, a difference of 0.28%), and Hispanic or Latino ($46,419, a difference of 0.38%).
| Demographics | Rating | Rank | Median Male Earnings |
| Ottawa | 0.0 /100 | #308 | Tragic $46,611 |
| Creek | 0.0 /100 | #309 | Tragic $46,594 |
| Cubans | 0.0 /100 | #310 | Tragic $46,580 |
| Apache | 0.0 /100 | #311 | Tragic $46,429 |
| Hispanics or Latinos | 0.0 /100 | #312 | Tragic $46,419 |
| Hondurans | 0.0 /100 | #313 | Tragic $46,374 |
| Chippewa | 0.0 /100 | #314 | Tragic $46,368 |
| Immigrants | Guatemala | 0.0 /100 | #315 | Tragic $46,244 |
| Immigrants | Caribbean | 0.0 /100 | #316 | Tragic $46,193 |
| Mexicans | 0.0 /100 | #317 | Tragic $46,147 |
| Cheyenne | 0.0 /100 | #318 | Tragic $46,062 |
| Haitians | 0.0 /100 | #319 | Tragic $45,903 |
| Immigrants | Honduras | 0.0 /100 | #320 | Tragic $45,787 |
| Fijians | 0.0 /100 | #321 | Tragic $45,607 |
| Sioux | 0.0 /100 | #322 | Tragic $45,566 |