Immigrants from Jamaica vs Immigrants from Grenada Median Household Income
COMPARE
Immigrants from Jamaica
Immigrants from Grenada
Median Household Income
Median Household Income Comparison
Immigrants from Jamaica
Immigrants from Grenada
$75,851
MEDIAN HOUSEHOLD INCOME
0.3/ 100
METRIC RATING
268th/ 347
METRIC RANK
$76,517
MEDIAN HOUSEHOLD INCOME
0.4/ 100
METRIC RATING
261st/ 347
METRIC RANK
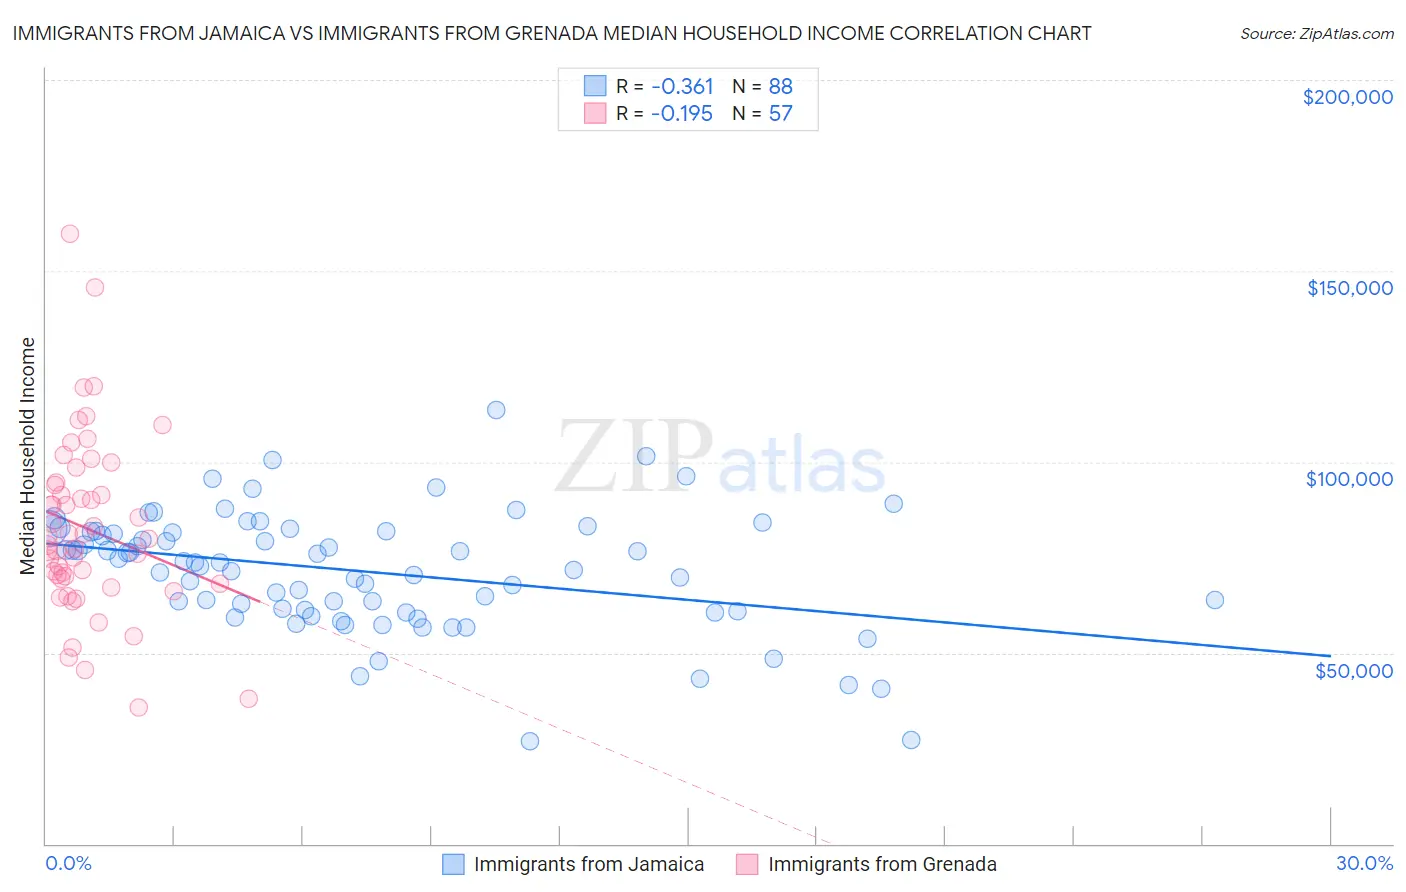
Immigrants from Jamaica vs Immigrants from Grenada Median Household Income Correlation Chart
The statistical analysis conducted on geographies consisting of 301,517,769 people shows a mild negative correlation between the proportion of Immigrants from Jamaica and median household income in the United States with a correlation coefficient (R) of -0.361 and weighted average of $75,851. Similarly, the statistical analysis conducted on geographies consisting of 67,183,202 people shows a poor negative correlation between the proportion of Immigrants from Grenada and median household income in the United States with a correlation coefficient (R) of -0.195 and weighted average of $76,517, a difference of 0.88%.
Median Household Income Correlation Summary
| Measurement | Immigrants from Jamaica | Immigrants from Grenada |
| Minimum | $26,823 | $35,840 |
| Maximum | $113,462 | $159,688 |
| Range | $86,639 | $123,848 |
| Mean | $71,387 | $82,524 |
| Median | $73,716 | $79,885 |
| Interquartile 25% (IQ1) | $60,983 | $68,699 |
| Interquartile 75% (IQ3) | $81,782 | $94,214 |
| Interquartile Range (IQR) | $20,798 | $25,515 |
| Standard Deviation (Sample) | $15,538 | $23,320 |
| Standard Deviation (Population) | $15,449 | $23,115 |
Demographics Similar to Immigrants from Jamaica and Immigrants from Grenada by Median Household Income
In terms of median household income, the demographic groups most similar to Immigrants from Jamaica are Cape Verdean ($75,848, a difference of 0.0%), German Russian ($75,856, a difference of 0.010%), Hmong ($75,839, a difference of 0.020%), Pennsylvania German ($75,814, a difference of 0.050%), and Somali ($75,782, a difference of 0.090%). Similarly, the demographic groups most similar to Immigrants from Grenada are Jamaican ($76,583, a difference of 0.090%), French American Indian ($76,387, a difference of 0.17%), Alaskan Athabascan ($76,383, a difference of 0.18%), Spanish American Indian ($76,670, a difference of 0.20%), and Immigrants from Nicaragua ($76,784, a difference of 0.35%).
| Demographics | Rating | Rank | Median Household Income |
| Sub-Saharan Africans | 0.8 /100 | #254 | Tragic $77,631 |
| Immigrants | Middle Africa | 0.8 /100 | #255 | Tragic $77,559 |
| Belizeans | 0.6 /100 | #256 | Tragic $77,028 |
| Immigrants | Senegal | 0.5 /100 | #257 | Tragic $76,915 |
| Immigrants | Nicaragua | 0.5 /100 | #258 | Tragic $76,784 |
| Spanish American Indians | 0.4 /100 | #259 | Tragic $76,670 |
| Jamaicans | 0.4 /100 | #260 | Tragic $76,583 |
| Immigrants | Grenada | 0.4 /100 | #261 | Tragic $76,517 |
| French American Indians | 0.4 /100 | #262 | Tragic $76,387 |
| Alaskan Athabascans | 0.4 /100 | #263 | Tragic $76,383 |
| Guatemalans | 0.3 /100 | #264 | Tragic $75,961 |
| Immigrants | Belize | 0.3 /100 | #265 | Tragic $75,938 |
| Americans | 0.3 /100 | #266 | Tragic $75,932 |
| German Russians | 0.3 /100 | #267 | Tragic $75,856 |
| Immigrants | Jamaica | 0.3 /100 | #268 | Tragic $75,851 |
| Cape Verdeans | 0.3 /100 | #269 | Tragic $75,848 |
| Hmong | 0.3 /100 | #270 | Tragic $75,839 |
| Pennsylvania Germans | 0.3 /100 | #271 | Tragic $75,814 |
| Somalis | 0.3 /100 | #272 | Tragic $75,782 |
| Liberians | 0.2 /100 | #273 | Tragic $75,667 |
| British West Indians | 0.2 /100 | #274 | Tragic $75,647 |