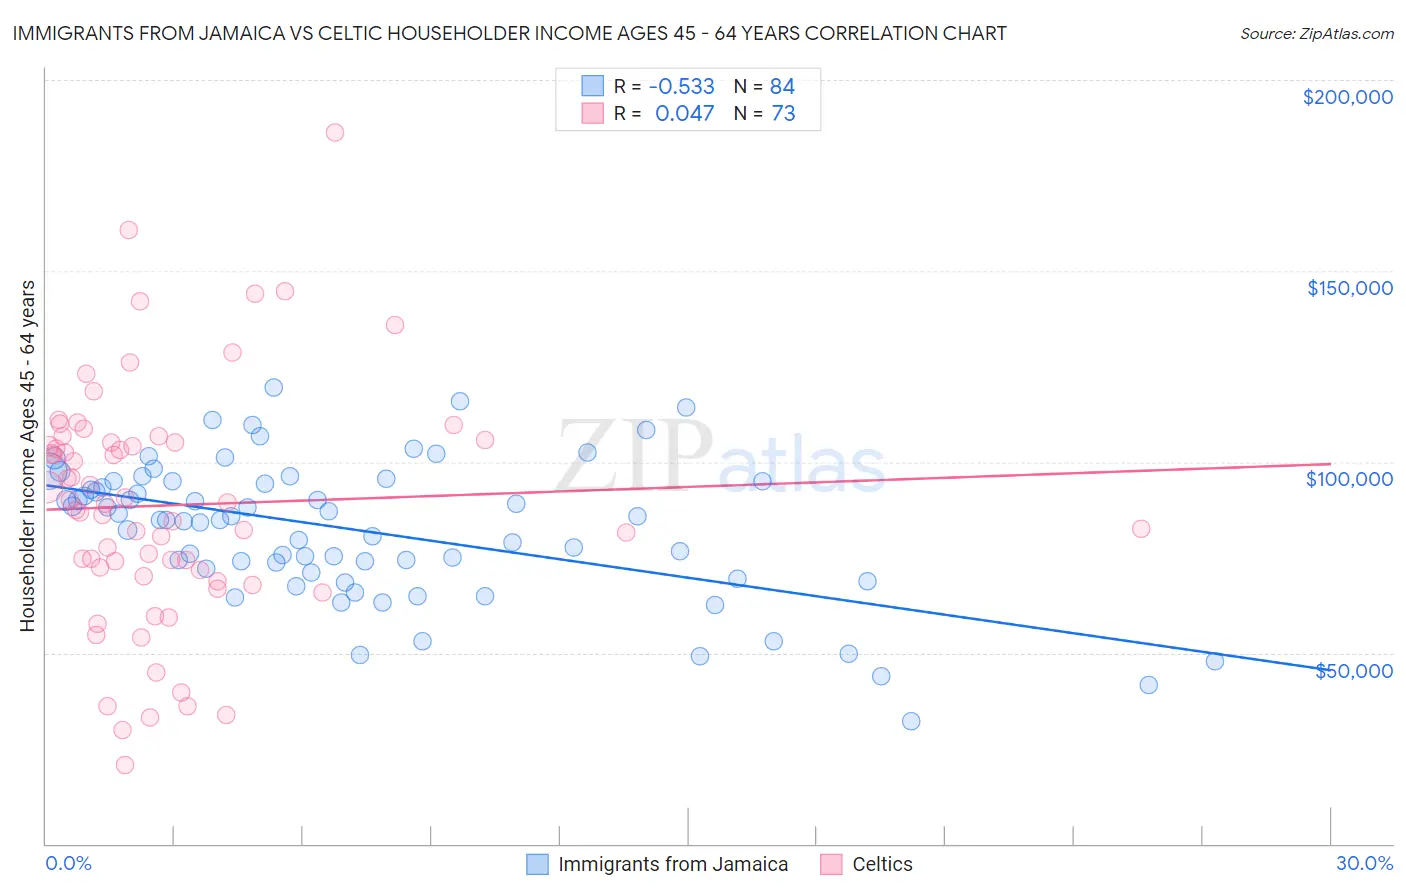
Immigrants from Jamaica vs Celtic Householder Income Ages 45 - 64 years
COMPARE
Immigrants from Jamaica
Celtic
Householder Income Ages 45 - 64 years
Householder Income Ages 45 - 64 years Comparison
Immigrants from Jamaica
Celtics
$87,035
HOUSEHOLDER INCOME AGES 45 - 64 YEARS
0.1/ 100
METRIC RATING
278th/ 347
METRIC RANK
$98,896
HOUSEHOLDER INCOME AGES 45 - 64 YEARS
32.9/ 100
METRIC RATING
192nd/ 347
METRIC RANK
Immigrants from Jamaica vs Celtic Householder Income Ages 45 - 64 years Correlation Chart
The statistical analysis conducted on geographies consisting of 301,245,641 people shows a substantial negative correlation between the proportion of Immigrants from Jamaica and household income with householder between the ages 45 and 64 in the United States with a correlation coefficient (R) of -0.533 and weighted average of $87,035. Similarly, the statistical analysis conducted on geographies consisting of 168,784,150 people shows no correlation between the proportion of Celtics and household income with householder between the ages 45 and 64 in the United States with a correlation coefficient (R) of 0.047 and weighted average of $98,896, a difference of 13.6%.
Householder Income Ages 45 - 64 years Correlation Summary
| Measurement | Immigrants from Jamaica | Celtic |
| Minimum | $31,923 | $20,731 |
| Maximum | $119,503 | $186,250 |
| Range | $87,580 | $165,519 |
| Mean | $82,100 | $88,627 |
| Median | $84,769 | $89,188 |
| Interquartile 25% (IQ1) | $71,502 | $70,916 |
| Interquartile 75% (IQ3) | $94,805 | $105,304 |
| Interquartile Range (IQR) | $23,303 | $34,388 |
| Standard Deviation (Sample) | $18,162 | $31,193 |
| Standard Deviation (Population) | $18,054 | $30,979 |
Similar Demographics by Householder Income Ages 45 - 64 years
Demographics Similar to Immigrants from Jamaica by Householder Income Ages 45 - 64 years
In terms of householder income ages 45 - 64 years, the demographic groups most similar to Immigrants from Jamaica are Yakama ($86,992, a difference of 0.050%), Immigrants from Somalia ($86,987, a difference of 0.050%), Yaqui ($86,914, a difference of 0.14%), Senegalese ($86,897, a difference of 0.16%), and Cree ($87,185, a difference of 0.17%).
| Demographics | Rating | Rank | Householder Income Ages 45 - 64 years |
| Guatemalans | 0.2 /100 | #271 | Tragic $87,705 |
| Cape Verdeans | 0.2 /100 | #272 | Tragic $87,580 |
| Spanish American Indians | 0.2 /100 | #273 | Tragic $87,561 |
| Iroquois | 0.1 /100 | #274 | Tragic $87,255 |
| Immigrants | Belize | 0.1 /100 | #275 | Tragic $87,229 |
| Immigrants | Latin America | 0.1 /100 | #276 | Tragic $87,219 |
| Cree | 0.1 /100 | #277 | Tragic $87,185 |
| Immigrants | Jamaica | 0.1 /100 | #278 | Tragic $87,035 |
| Yakama | 0.1 /100 | #279 | Tragic $86,992 |
| Immigrants | Somalia | 0.1 /100 | #280 | Tragic $86,987 |
| Yaqui | 0.1 /100 | #281 | Tragic $86,914 |
| Senegalese | 0.1 /100 | #282 | Tragic $86,897 |
| Mexicans | 0.1 /100 | #283 | Tragic $86,816 |
| Central American Indians | 0.1 /100 | #284 | Tragic $86,764 |
| Blackfeet | 0.1 /100 | #285 | Tragic $86,595 |
Demographics Similar to Celtics by Householder Income Ages 45 - 64 years
In terms of householder income ages 45 - 64 years, the demographic groups most similar to Celtics are Kenyan ($98,970, a difference of 0.070%), Hawaiian ($98,778, a difference of 0.12%), French Canadian ($99,093, a difference of 0.20%), Immigrants from South America ($99,126, a difference of 0.23%), and Uruguayan ($98,660, a difference of 0.24%).
| Demographics | Rating | Rank | Householder Income Ages 45 - 64 years |
| Colombians | 43.2 /100 | #185 | Average $99,772 |
| Dutch | 41.7 /100 | #186 | Average $99,650 |
| Iraqis | 38.5 /100 | #187 | Fair $99,387 |
| Immigrants | Portugal | 36.3 /100 | #188 | Fair $99,203 |
| Immigrants | South America | 35.4 /100 | #189 | Fair $99,126 |
| French Canadians | 35.1 /100 | #190 | Fair $99,093 |
| Kenyans | 33.7 /100 | #191 | Fair $98,970 |
| Celtics | 32.9 /100 | #192 | Fair $98,896 |
| Hawaiians | 31.6 /100 | #193 | Fair $98,778 |
| Uruguayans | 30.3 /100 | #194 | Fair $98,660 |
| Spanish | 29.2 /100 | #195 | Fair $98,554 |
| Immigrants | Eastern Africa | 28.3 /100 | #196 | Fair $98,467 |
| Puget Sound Salish | 27.0 /100 | #197 | Fair $98,340 |
| Immigrants | Iraq | 25.7 /100 | #198 | Fair $98,201 |
| Whites/Caucasians | 24.6 /100 | #199 | Fair $98,091 |