Immigrants from Italy vs Iranian Median Family Income
COMPARE
Immigrants from Italy
Iranian
Median Family Income
Median Family Income Comparison
Immigrants from Italy
Iranians
$112,848
MEDIAN FAMILY INCOME
99.4/ 100
METRIC RATING
74th/ 347
METRIC RANK
$133,839
MEDIAN FAMILY INCOME
100.0/ 100
METRIC RATING
5th/ 347
METRIC RANK
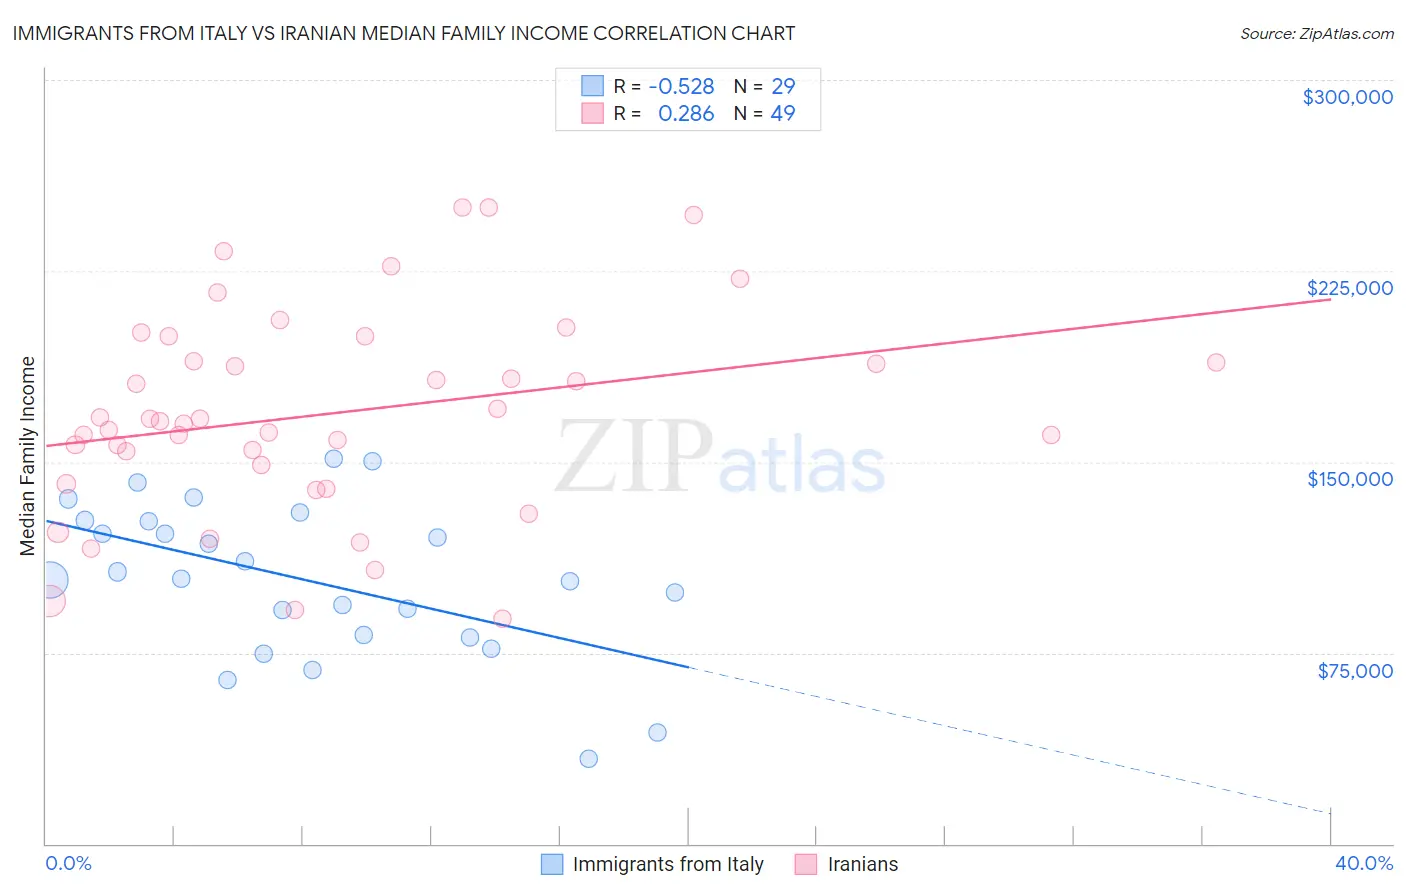
Immigrants from Italy vs Iranian Median Family Income Correlation Chart
The statistical analysis conducted on geographies consisting of 324,100,619 people shows a substantial negative correlation between the proportion of Immigrants from Italy and median family income in the United States with a correlation coefficient (R) of -0.528 and weighted average of $112,848. Similarly, the statistical analysis conducted on geographies consisting of 316,569,365 people shows a weak positive correlation between the proportion of Iranians and median family income in the United States with a correlation coefficient (R) of 0.286 and weighted average of $133,839, a difference of 18.6%.
Median Family Income Correlation Summary
| Measurement | Immigrants from Italy | Iranian |
| Minimum | $33,393 | $88,250 |
| Maximum | $151,250 | $250,001 |
| Range | $117,857 | $161,751 |
| Mean | $103,776 | $169,044 |
| Median | $104,131 | $166,027 |
| Interquartile 25% (IQ1) | $81,528 | $144,981 |
| Interquartile 75% (IQ3) | $126,861 | $194,217 |
| Interquartile Range (IQR) | $45,333 | $49,236 |
| Standard Deviation (Sample) | $30,032 | $39,948 |
| Standard Deviation (Population) | $29,509 | $39,538 |
Similar Demographics by Median Family Income
Demographics Similar to Immigrants from Italy by Median Family Income
In terms of median family income, the demographic groups most similar to Immigrants from Italy are Laotian ($112,859, a difference of 0.010%), Afghan ($112,971, a difference of 0.11%), Immigrants from Western Europe ($112,688, a difference of 0.14%), Argentinean ($112,665, a difference of 0.16%), and Immigrants from Eastern Europe ($112,527, a difference of 0.29%).
| Demographics | Rating | Rank | Median Family Income |
| Immigrants | Spain | 99.7 /100 | #67 | Exceptional $113,815 |
| Immigrants | Serbia | 99.6 /100 | #68 | Exceptional $113,463 |
| Immigrants | Bulgaria | 99.6 /100 | #69 | Exceptional $113,461 |
| Immigrants | Romania | 99.6 /100 | #70 | Exceptional $113,434 |
| South Africans | 99.5 /100 | #71 | Exceptional $113,229 |
| Afghans | 99.5 /100 | #72 | Exceptional $112,971 |
| Laotians | 99.5 /100 | #73 | Exceptional $112,859 |
| Immigrants | Italy | 99.4 /100 | #74 | Exceptional $112,848 |
| Immigrants | Western Europe | 99.4 /100 | #75 | Exceptional $112,688 |
| Argentineans | 99.4 /100 | #76 | Exceptional $112,665 |
| Immigrants | Eastern Europe | 99.4 /100 | #77 | Exceptional $112,527 |
| Immigrants | Canada | 99.3 /100 | #78 | Exceptional $112,374 |
| Italians | 99.3 /100 | #79 | Exceptional $112,372 |
| Immigrants | Croatia | 99.3 /100 | #80 | Exceptional $112,323 |
| Immigrants | North America | 99.2 /100 | #81 | Exceptional $112,151 |
Demographics Similar to Iranians by Median Family Income
In terms of median family income, the demographic groups most similar to Iranians are Immigrants from India ($134,028, a difference of 0.14%), Immigrants from Singapore ($134,818, a difference of 0.73%), Thai ($131,281, a difference of 1.9%), Immigrants from Hong Kong ($131,067, a difference of 2.1%), and Immigrants from Iran ($130,894, a difference of 2.2%).
| Demographics | Rating | Rank | Median Family Income |
| Filipinos | 100.0 /100 | #1 | Exceptional $138,397 |
| Immigrants | Taiwan | 100.0 /100 | #2 | Exceptional $136,949 |
| Immigrants | Singapore | 100.0 /100 | #3 | Exceptional $134,818 |
| Immigrants | India | 100.0 /100 | #4 | Exceptional $134,028 |
| Iranians | 100.0 /100 | #5 | Exceptional $133,839 |
| Thais | 100.0 /100 | #6 | Exceptional $131,281 |
| Immigrants | Hong Kong | 100.0 /100 | #7 | Exceptional $131,067 |
| Immigrants | Iran | 100.0 /100 | #8 | Exceptional $130,894 |
| Okinawans | 100.0 /100 | #9 | Exceptional $129,979 |
| Immigrants | Ireland | 100.0 /100 | #10 | Exceptional $127,584 |
| Immigrants | Israel | 100.0 /100 | #11 | Exceptional $127,430 |
| Cypriots | 100.0 /100 | #12 | Exceptional $127,064 |
| Immigrants | Australia | 100.0 /100 | #13 | Exceptional $126,620 |
| Immigrants | South Central Asia | 100.0 /100 | #14 | Exceptional $125,956 |
| Eastern Europeans | 100.0 /100 | #15 | Exceptional $125,546 |