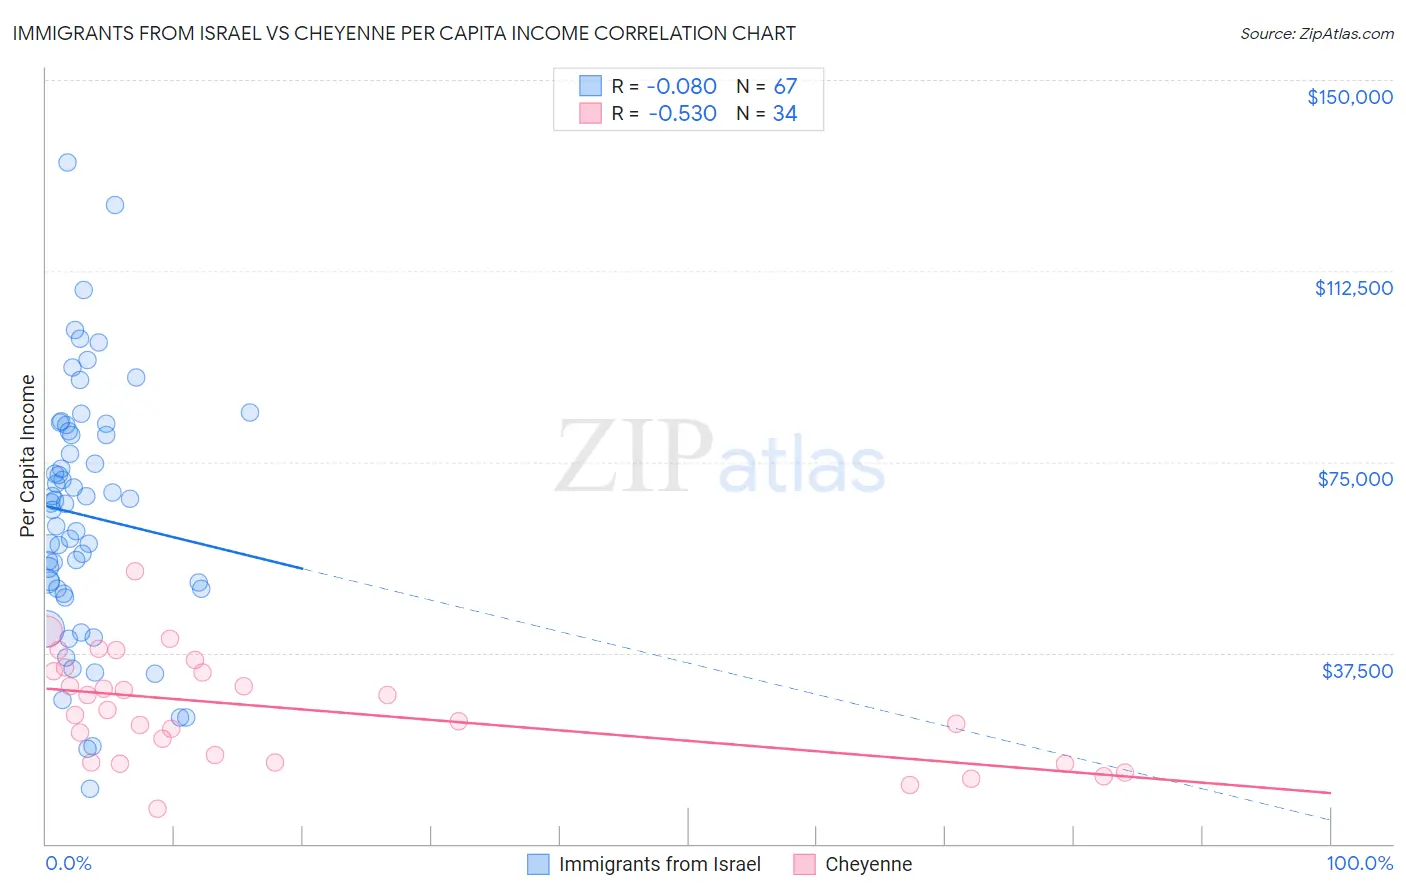
Immigrants from Israel vs Cheyenne Per Capita Income
COMPARE
Immigrants from Israel
Cheyenne
Per Capita Income
Per Capita Income Comparison
Immigrants from Israel
Cheyenne
$57,384
PER CAPITA INCOME
100.0/ 100
METRIC RATING
7th/ 347
METRIC RANK
$35,276
PER CAPITA INCOME
0.0/ 100
METRIC RATING
323rd/ 347
METRIC RANK
Immigrants from Israel vs Cheyenne Per Capita Income Correlation Chart
The statistical analysis conducted on geographies consisting of 210,034,998 people shows a slight negative correlation between the proportion of Immigrants from Israel and per capita income in the United States with a correlation coefficient (R) of -0.080 and weighted average of $57,384. Similarly, the statistical analysis conducted on geographies consisting of 80,722,590 people shows a substantial negative correlation between the proportion of Cheyenne and per capita income in the United States with a correlation coefficient (R) of -0.530 and weighted average of $35,276, a difference of 62.7%.
Per Capita Income Correlation Summary
| Measurement | Immigrants from Israel | Cheyenne |
| Minimum | $10,922 | $6,772 |
| Maximum | $133,703 | $53,471 |
| Range | $122,781 | $46,699 |
| Mean | $64,480 | $26,352 |
| Median | $66,721 | $25,776 |
| Interquartile 25% (IQ1) | $50,016 | $15,918 |
| Interquartile 75% (IQ3) | $80,903 | $33,955 |
| Interquartile Range (IQR) | $30,888 | $18,037 |
| Standard Deviation (Sample) | $24,657 | $10,544 |
| Standard Deviation (Population) | $24,473 | $10,388 |
Similar Demographics by Per Capita Income
Demographics Similar to Immigrants from Israel by Per Capita Income
In terms of per capita income, the demographic groups most similar to Immigrants from Israel are Immigrants from Taiwan ($57,742, a difference of 0.62%), Immigrants from Iran ($57,759, a difference of 0.65%), Immigrants from Australia ($57,953, a difference of 0.99%), Immigrants from Hong Kong ($56,709, a difference of 1.2%), and Immigrants from Ireland ($56,584, a difference of 1.4%).
| Demographics | Rating | Rank | Per Capita Income |
| Filipinos | 100.0 /100 | #1 | Exceptional $59,066 |
| Iranians | 100.0 /100 | #2 | Exceptional $58,786 |
| Immigrants | Singapore | 100.0 /100 | #3 | Exceptional $58,353 |
| Immigrants | Australia | 100.0 /100 | #4 | Exceptional $57,953 |
| Immigrants | Iran | 100.0 /100 | #5 | Exceptional $57,759 |
| Immigrants | Taiwan | 100.0 /100 | #6 | Exceptional $57,742 |
| Immigrants | Israel | 100.0 /100 | #7 | Exceptional $57,384 |
| Immigrants | Hong Kong | 100.0 /100 | #8 | Exceptional $56,709 |
| Immigrants | Ireland | 100.0 /100 | #9 | Exceptional $56,584 |
| Okinawans | 100.0 /100 | #10 | Exceptional $55,817 |
| Eastern Europeans | 100.0 /100 | #11 | Exceptional $55,780 |
| Immigrants | Sweden | 100.0 /100 | #12 | Exceptional $55,582 |
| Immigrants | India | 100.0 /100 | #13 | Exceptional $55,268 |
| Immigrants | Belgium | 100.0 /100 | #14 | Exceptional $55,082 |
| Cypriots | 100.0 /100 | #15 | Exceptional $54,899 |
Demographics Similar to Cheyenne by Per Capita Income
In terms of per capita income, the demographic groups most similar to Cheyenne are Kiowa ($35,102, a difference of 0.50%), Creek ($35,546, a difference of 0.76%), Black/African American ($35,564, a difference of 0.82%), Immigrants from Central America ($34,974, a difference of 0.87%), and Immigrants from Cuba ($34,910, a difference of 1.1%).
| Demographics | Rating | Rank | Per Capita Income |
| Choctaw | 0.0 /100 | #316 | Tragic $35,999 |
| Dutch West Indians | 0.0 /100 | #317 | Tragic $35,922 |
| Bangladeshis | 0.0 /100 | #318 | Tragic $35,897 |
| Immigrants | Congo | 0.0 /100 | #319 | Tragic $35,720 |
| Hispanics or Latinos | 0.0 /100 | #320 | Tragic $35,688 |
| Blacks/African Americans | 0.0 /100 | #321 | Tragic $35,564 |
| Creek | 0.0 /100 | #322 | Tragic $35,546 |
| Cheyenne | 0.0 /100 | #323 | Tragic $35,276 |
| Kiowa | 0.0 /100 | #324 | Tragic $35,102 |
| Immigrants | Central America | 0.0 /100 | #325 | Tragic $34,974 |
| Immigrants | Cuba | 0.0 /100 | #326 | Tragic $34,910 |
| Apache | 0.0 /100 | #327 | Tragic $34,886 |
| Menominee | 0.0 /100 | #328 | Tragic $34,578 |
| Mexicans | 0.0 /100 | #329 | Tragic $34,559 |
| Spanish American Indians | 0.0 /100 | #330 | Tragic $34,195 |