Immigrants from Iran vs Comanche Median Family Income
COMPARE
Immigrants from Iran
Comanche
Median Family Income
Median Family Income Comparison
Immigrants from Iran
Comanche
$130,894
MEDIAN FAMILY INCOME
100.0/ 100
METRIC RATING
8th/ 347
METRIC RANK
$88,556
MEDIAN FAMILY INCOME
0.1/ 100
METRIC RATING
282nd/ 347
METRIC RANK
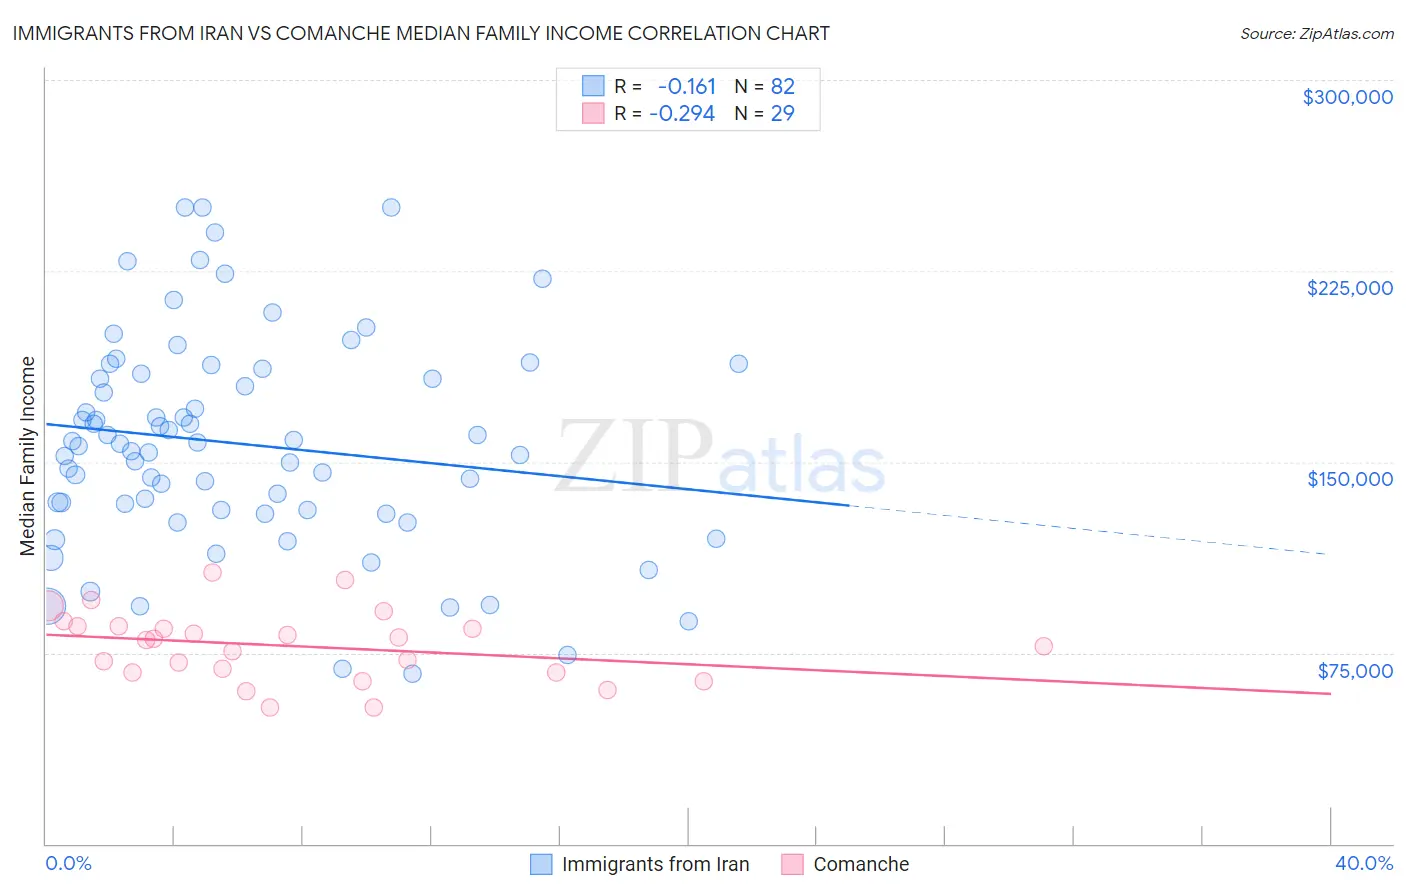
Immigrants from Iran vs Comanche Median Family Income Correlation Chart
The statistical analysis conducted on geographies consisting of 279,798,585 people shows a poor negative correlation between the proportion of Immigrants from Iran and median family income in the United States with a correlation coefficient (R) of -0.161 and weighted average of $130,894. Similarly, the statistical analysis conducted on geographies consisting of 109,751,078 people shows a weak negative correlation between the proportion of Comanche and median family income in the United States with a correlation coefficient (R) of -0.294 and weighted average of $88,556, a difference of 47.8%.
Median Family Income Correlation Summary
| Measurement | Immigrants from Iran | Comanche |
| Minimum | $66,897 | $53,472 |
| Maximum | $250,001 | $106,375 |
| Range | $183,104 | $52,903 |
| Mean | $156,930 | $77,578 |
| Median | $156,641 | $79,900 |
| Interquartile 25% (IQ1) | $131,095 | $67,370 |
| Interquartile 75% (IQ3) | $184,731 | $85,455 |
| Interquartile Range (IQR) | $53,637 | $18,086 |
| Standard Deviation (Sample) | $42,072 | $13,620 |
| Standard Deviation (Population) | $41,815 | $13,383 |
Similar Demographics by Median Family Income
Demographics Similar to Immigrants from Iran by Median Family Income
In terms of median family income, the demographic groups most similar to Immigrants from Iran are Immigrants from Hong Kong ($131,067, a difference of 0.13%), Thai ($131,281, a difference of 0.30%), Okinawan ($129,979, a difference of 0.70%), Iranian ($133,839, a difference of 2.2%), and Immigrants from India ($134,028, a difference of 2.4%).
| Demographics | Rating | Rank | Median Family Income |
| Filipinos | 100.0 /100 | #1 | Exceptional $138,397 |
| Immigrants | Taiwan | 100.0 /100 | #2 | Exceptional $136,949 |
| Immigrants | Singapore | 100.0 /100 | #3 | Exceptional $134,818 |
| Immigrants | India | 100.0 /100 | #4 | Exceptional $134,028 |
| Iranians | 100.0 /100 | #5 | Exceptional $133,839 |
| Thais | 100.0 /100 | #6 | Exceptional $131,281 |
| Immigrants | Hong Kong | 100.0 /100 | #7 | Exceptional $131,067 |
| Immigrants | Iran | 100.0 /100 | #8 | Exceptional $130,894 |
| Okinawans | 100.0 /100 | #9 | Exceptional $129,979 |
| Immigrants | Ireland | 100.0 /100 | #10 | Exceptional $127,584 |
| Immigrants | Israel | 100.0 /100 | #11 | Exceptional $127,430 |
| Cypriots | 100.0 /100 | #12 | Exceptional $127,064 |
| Immigrants | Australia | 100.0 /100 | #13 | Exceptional $126,620 |
| Immigrants | South Central Asia | 100.0 /100 | #14 | Exceptional $125,956 |
| Eastern Europeans | 100.0 /100 | #15 | Exceptional $125,546 |
Demographics Similar to Comanche by Median Family Income
In terms of median family income, the demographic groups most similar to Comanche are Blackfeet ($88,717, a difference of 0.18%), Bangladeshi ($88,358, a difference of 0.22%), Indonesian ($88,301, a difference of 0.29%), Guatemalan ($88,295, a difference of 0.29%), and Immigrants from Nicaragua ($88,267, a difference of 0.33%).
| Demographics | Rating | Rank | Median Family Income |
| Immigrants | St. Vincent and the Grenadines | 0.2 /100 | #275 | Tragic $90,094 |
| Immigrants | Zaire | 0.1 /100 | #276 | Tragic $89,285 |
| Immigrants | Jamaica | 0.1 /100 | #277 | Tragic $89,268 |
| Immigrants | Grenada | 0.1 /100 | #278 | Tragic $89,249 |
| Immigrants | Belize | 0.1 /100 | #279 | Tragic $89,197 |
| British West Indians | 0.1 /100 | #280 | Tragic $88,987 |
| Blackfeet | 0.1 /100 | #281 | Tragic $88,717 |
| Comanche | 0.1 /100 | #282 | Tragic $88,556 |
| Bangladeshis | 0.1 /100 | #283 | Tragic $88,358 |
| Indonesians | 0.1 /100 | #284 | Tragic $88,301 |
| Guatemalans | 0.1 /100 | #285 | Tragic $88,295 |
| Immigrants | Nicaragua | 0.1 /100 | #286 | Tragic $88,267 |
| Potawatomi | 0.1 /100 | #287 | Tragic $88,265 |
| Cherokee | 0.1 /100 | #288 | Tragic $88,209 |
| Central American Indians | 0.1 /100 | #289 | Tragic $88,034 |