Immigrants from Indonesia vs Immigrants from Bosnia and Herzegovina Householder Income Over 65 years
COMPARE
Immigrants from Indonesia
Immigrants from Bosnia and Herzegovina
Householder Income Over 65 years
Householder Income Over 65 years Comparison
Immigrants from Indonesia
Immigrants from Bosnia and Herzegovina
$66,694
HOUSEHOLDER INCOME OVER 65 YEARS
99.8/ 100
METRIC RATING
49th/ 347
METRIC RANK
$55,986
HOUSEHOLDER INCOME OVER 65 YEARS
0.5/ 100
METRIC RATING
250th/ 347
METRIC RANK
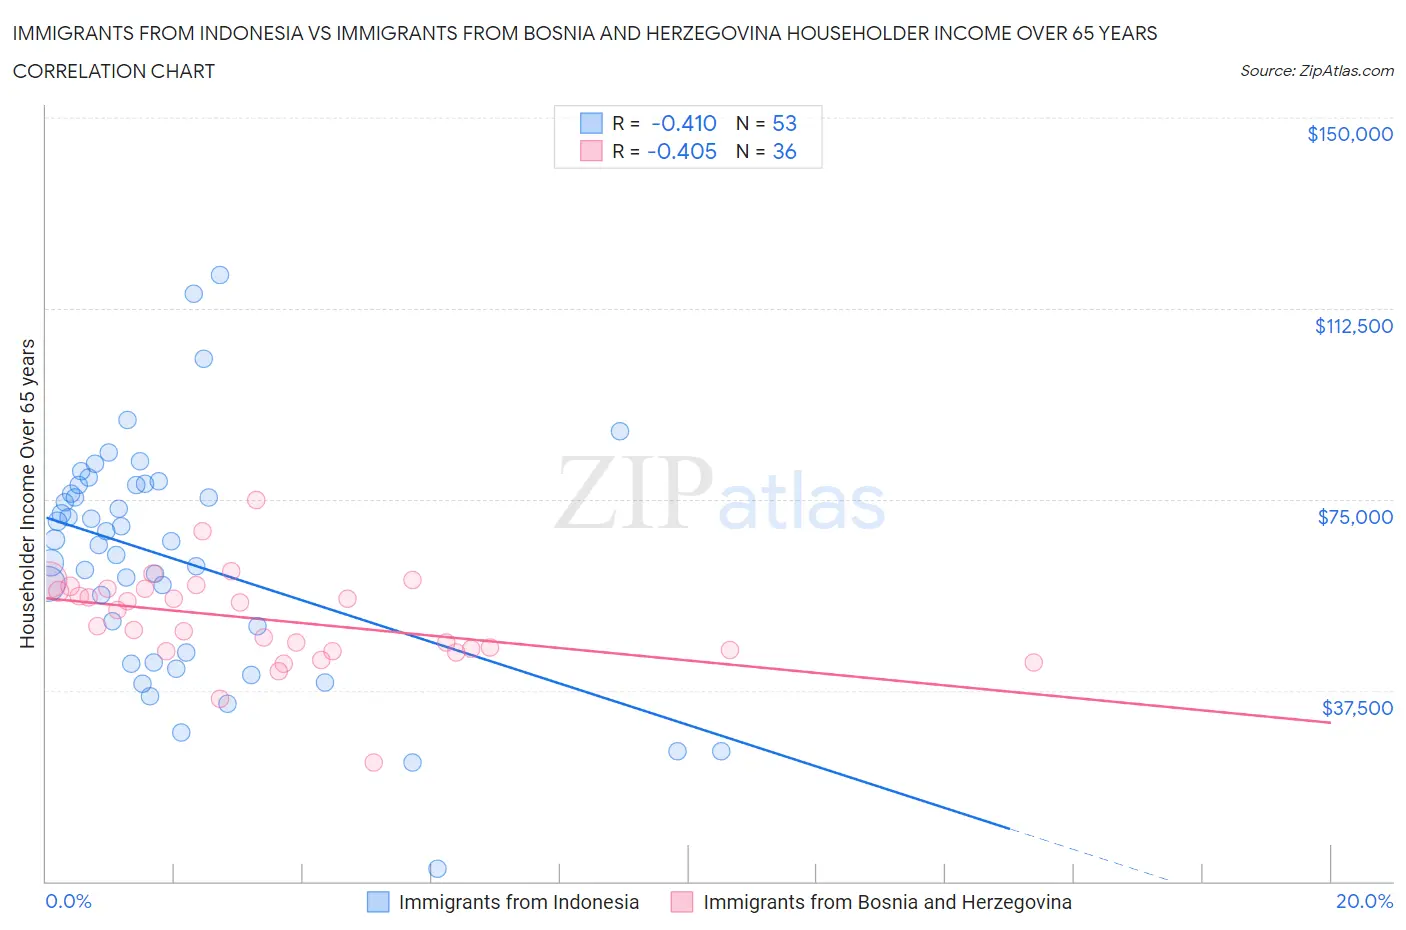
Immigrants from Indonesia vs Immigrants from Bosnia and Herzegovina Householder Income Over 65 years Correlation Chart
The statistical analysis conducted on geographies consisting of 215,458,271 people shows a moderate negative correlation between the proportion of Immigrants from Indonesia and household income with householder over the age of 65 in the United States with a correlation coefficient (R) of -0.410 and weighted average of $66,694. Similarly, the statistical analysis conducted on geographies consisting of 156,709,633 people shows a moderate negative correlation between the proportion of Immigrants from Bosnia and Herzegovina and household income with householder over the age of 65 in the United States with a correlation coefficient (R) of -0.405 and weighted average of $55,986, a difference of 19.1%.
Householder Income Over 65 years Correlation Summary
| Measurement | Immigrants from Indonesia | Immigrants from Bosnia and Herzegovina |
| Minimum | $2,499 | $23,391 |
| Maximum | $119,035 | $74,953 |
| Range | $116,536 | $51,562 |
| Mean | $63,155 | $51,359 |
| Median | $66,875 | $51,669 |
| Interquartile 25% (IQ1) | $43,885 | $45,302 |
| Interquartile 75% (IQ3) | $77,853 | $57,366 |
| Interquartile Range (IQR) | $33,968 | $12,064 |
| Standard Deviation (Sample) | $22,797 | $9,347 |
| Standard Deviation (Population) | $22,581 | $9,217 |
Similar Demographics by Householder Income Over 65 years
Demographics Similar to Immigrants from Indonesia by Householder Income Over 65 years
In terms of householder income over 65 years, the demographic groups most similar to Immigrants from Indonesia are Immigrants from Turkey ($66,672, a difference of 0.030%), Israeli ($66,636, a difference of 0.090%), Immigrants from Scotland ($66,620, a difference of 0.11%), Immigrants from Pakistan ($66,617, a difference of 0.12%), and Immigrants from France ($66,826, a difference of 0.20%).
| Demographics | Rating | Rank | Householder Income Over 65 years |
| New Zealanders | 99.9 /100 | #42 | Exceptional $67,333 |
| Latvians | 99.9 /100 | #43 | Exceptional $67,326 |
| Immigrants | South Africa | 99.9 /100 | #44 | Exceptional $67,234 |
| Immigrants | Afghanistan | 99.8 /100 | #45 | Exceptional $67,007 |
| Cambodians | 99.8 /100 | #46 | Exceptional $66,892 |
| Australians | 99.8 /100 | #47 | Exceptional $66,891 |
| Immigrants | France | 99.8 /100 | #48 | Exceptional $66,826 |
| Immigrants | Indonesia | 99.8 /100 | #49 | Exceptional $66,694 |
| Immigrants | Turkey | 99.7 /100 | #50 | Exceptional $66,672 |
| Israelis | 99.7 /100 | #51 | Exceptional $66,636 |
| Immigrants | Scotland | 99.7 /100 | #52 | Exceptional $66,620 |
| Immigrants | Pakistan | 99.7 /100 | #53 | Exceptional $66,617 |
| Immigrants | Netherlands | 99.7 /100 | #54 | Exceptional $66,463 |
| Immigrants | Czechoslovakia | 99.7 /100 | #55 | Exceptional $66,376 |
| Laotians | 99.6 /100 | #56 | Exceptional $66,306 |
Demographics Similar to Immigrants from Bosnia and Herzegovina by Householder Income Over 65 years
In terms of householder income over 65 years, the demographic groups most similar to Immigrants from Bosnia and Herzegovina are Immigrants from Portugal ($55,924, a difference of 0.11%), Mexican American Indian ($56,089, a difference of 0.19%), Vietnamese ($56,143, a difference of 0.28%), Yakama ($56,234, a difference of 0.44%), and Osage ($55,677, a difference of 0.55%).
| Demographics | Rating | Rank | Householder Income Over 65 years |
| Guyanese | 0.8 /100 | #243 | Tragic $56,351 |
| Hmong | 0.8 /100 | #244 | Tragic $56,339 |
| Immigrants | Uzbekistan | 0.8 /100 | #245 | Tragic $56,331 |
| Central Americans | 0.8 /100 | #246 | Tragic $56,321 |
| Yakama | 0.7 /100 | #247 | Tragic $56,234 |
| Vietnamese | 0.6 /100 | #248 | Tragic $56,143 |
| Mexican American Indians | 0.6 /100 | #249 | Tragic $56,089 |
| Immigrants | Bosnia and Herzegovina | 0.5 /100 | #250 | Tragic $55,986 |
| Immigrants | Portugal | 0.5 /100 | #251 | Tragic $55,924 |
| Osage | 0.4 /100 | #252 | Tragic $55,677 |
| Immigrants | Trinidad and Tobago | 0.4 /100 | #253 | Tragic $55,598 |
| Americans | 0.3 /100 | #254 | Tragic $55,527 |
| Immigrants | Bangladesh | 0.3 /100 | #255 | Tragic $55,394 |
| German Russians | 0.3 /100 | #256 | Tragic $55,356 |
| Trinidadians and Tobagonians | 0.3 /100 | #257 | Tragic $55,327 |