Immigrants from Haiti vs Bangladeshi Median Household Income
COMPARE
Immigrants from Haiti
Bangladeshi
Median Household Income
Median Household Income Comparison
Immigrants from Haiti
Bangladeshis
$72,599
MEDIAN HOUSEHOLD INCOME
0.0/ 100
METRIC RATING
304th/ 347
METRIC RANK
$74,112
MEDIAN HOUSEHOLD INCOME
0.1/ 100
METRIC RATING
290th/ 347
METRIC RANK
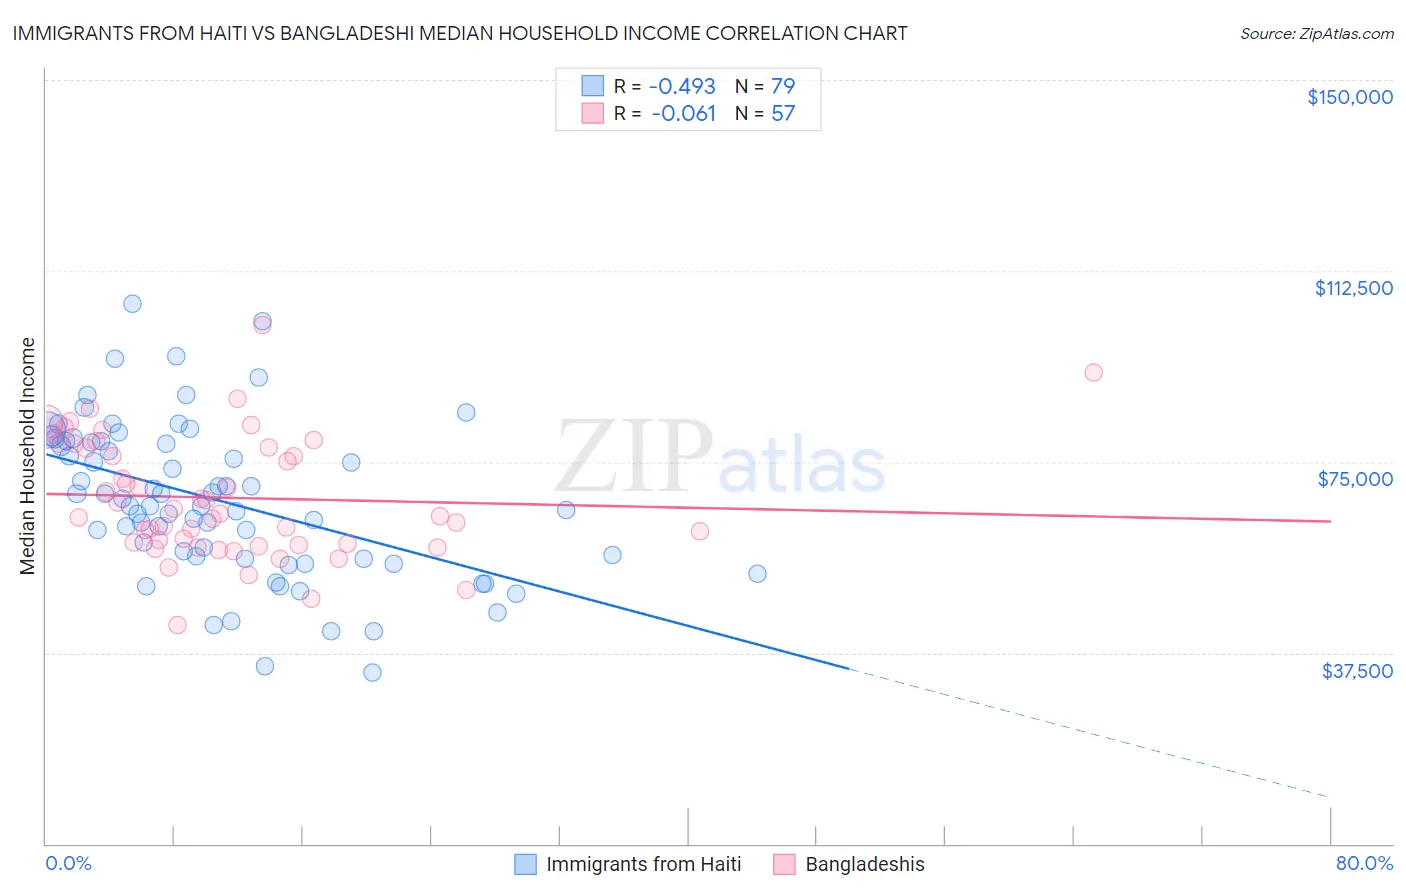
Immigrants from Haiti vs Bangladeshi Median Household Income Correlation Chart
The statistical analysis conducted on geographies consisting of 225,133,235 people shows a moderate negative correlation between the proportion of Immigrants from Haiti and median household income in the United States with a correlation coefficient (R) of -0.493 and weighted average of $72,599. Similarly, the statistical analysis conducted on geographies consisting of 141,320,446 people shows a slight negative correlation between the proportion of Bangladeshis and median household income in the United States with a correlation coefficient (R) of -0.061 and weighted average of $74,112, a difference of 2.1%.
Median Household Income Correlation Summary
| Measurement | Immigrants from Haiti | Bangladeshi |
| Minimum | $33,629 | $42,858 |
| Maximum | $105,986 | $101,820 |
| Range | $72,357 | $58,962 |
| Mean | $67,399 | $67,935 |
| Median | $66,369 | $64,799 |
| Interquartile 25% (IQ1) | $56,044 | $58,792 |
| Interquartile 75% (IQ3) | $78,973 | $78,284 |
| Interquartile Range (IQR) | $22,929 | $19,492 |
| Standard Deviation (Sample) | $15,193 | $11,839 |
| Standard Deviation (Population) | $15,096 | $11,735 |
Demographics Similar to Immigrants from Haiti and Bangladeshis by Median Household Income
In terms of median household income, the demographic groups most similar to Immigrants from Haiti are Honduran ($72,588, a difference of 0.020%), Potawatomi ($72,576, a difference of 0.030%), African ($72,650, a difference of 0.070%), Shoshone ($72,660, a difference of 0.080%), and Cherokee ($72,682, a difference of 0.11%). Similarly, the demographic groups most similar to Bangladeshis are Fijian ($74,205, a difference of 0.13%), Immigrants from Central America ($74,217, a difference of 0.14%), Iroquois ($74,279, a difference of 0.23%), Hispanic or Latino ($73,823, a difference of 0.39%), and Comanche ($73,747, a difference of 0.50%).
| Demographics | Rating | Rank | Median Household Income |
| Iroquois | 0.1 /100 | #287 | Tragic $74,279 |
| Immigrants | Central America | 0.1 /100 | #288 | Tragic $74,217 |
| Fijians | 0.1 /100 | #289 | Tragic $74,205 |
| Bangladeshis | 0.1 /100 | #290 | Tragic $74,112 |
| Hispanics or Latinos | 0.1 /100 | #291 | Tragic $73,823 |
| Comanche | 0.1 /100 | #292 | Tragic $73,747 |
| Immigrants | Cabo Verde | 0.1 /100 | #293 | Tragic $73,515 |
| Blackfeet | 0.1 /100 | #294 | Tragic $73,509 |
| Cubans | 0.1 /100 | #295 | Tragic $73,392 |
| Haitians | 0.1 /100 | #296 | Tragic $73,306 |
| Immigrants | Mexico | 0.0 /100 | #297 | Tragic $73,160 |
| Paiute | 0.0 /100 | #298 | Tragic $72,959 |
| Indonesians | 0.0 /100 | #299 | Tragic $72,856 |
| Immigrants | Dominica | 0.0 /100 | #300 | Tragic $72,760 |
| Cherokee | 0.0 /100 | #301 | Tragic $72,682 |
| Shoshone | 0.0 /100 | #302 | Tragic $72,660 |
| Africans | 0.0 /100 | #303 | Tragic $72,650 |
| Immigrants | Haiti | 0.0 /100 | #304 | Tragic $72,599 |
| Hondurans | 0.0 /100 | #305 | Tragic $72,588 |
| Potawatomi | 0.0 /100 | #306 | Tragic $72,576 |
| Ute | 0.0 /100 | #307 | Tragic $72,402 |