Immigrants from Guyana vs Russian Householder Income Ages 45 - 64 years

COMPARE

Immigrants from Guyana
Race
Ancestry
AfghanAfricanAlaska NativeAlaskan AthabascanAlbanianAleutAlsatianAmericanApacheArabArapahoArgentineanArmenianAssyrian/Chaldean/SyriacAustralianAustrianBahamianBangladeshiBarbadianBasqueBelgianBelizeanBermudanBhutaneseBlackfeetBolivianBrazilianBritishBritish West IndianBulgarianBurmeseCajunCambodianCanadianCape VerdeanCarpatho RusynCelticCentral AmericanCentral American IndianCherokeeCheyenneChickasawChileanChineseChippewaChoctawColombianColvilleComancheCosta RicanCreeCreekCroatianCrowCubanCypriotCzechCzechoslovakianDanishDelawareDominicanDutchDutch West IndianEastern EuropeanEcuadorianEgyptianEnglishEstonianEthiopianEuropeanFijianFilipinoFinnishFrenchFrench American IndianFrench CanadianGermanGerman RussianGhanaianGreekGuamanian/ChamorroGuatemalanGuyaneseHaitianHmongHonduranHopiHoumaHungarianIcelanderIndian (Asian)IndonesianInupiatIranianIraqiIrishIroquoisIsraeliItalianJamaicanJapaneseJordanianKenyanKiowaKoreanLaotianLatvianLebaneseLiberianLithuanianLumbeeLuxembourgerMacedonianMalaysianMalteseMarshalleseMenomineeMexicanMexican American IndianMongolianMoroccanNative HawaiianNavajoNepaleseNew ZealanderNicaraguanNigerianNorthern EuropeanNorwegianOkinawanOsageOttawaPaiutePakistaniPalestinianPanamanianParaguayanPennsylvania GermanPeruvianPimaPolishPortuguesePotawatomiPuebloPuerto RicanPuget Sound SalishRomanianSalvadoranSamoanScandinavianScotch-IrishScottishSeminoleSenegaleseSerbianShoshoneSierra LeoneanSiouxSlavicSlovakSloveneSomaliSouth AfricanSouth AmericanSouth American IndianSoviet UnionSpaniardSpanishSpanish AmericanSpanish American IndianSri LankanSubsaharan AfricanSudaneseSwedishSwissSyrianTaiwaneseThaiTlingit-HaidaTohono O'OdhamTonganTrinidadian and TobagonianTsimshianTurkishU.S. Virgin IslanderUgandanUkrainianUruguayanUteVenezuelanVietnameseWelshWest IndianYakamaYaquiYugoslavianYumanYup'ikZimbabwean
Immigration
NonimmigrantsImmigrantsAfghanistanAfricaAlbaniaArgentinaArmeniaAsiaAustraliaAustriaBahamasBangladeshBarbadosBelarusBelgiumBelizeBoliviaBosnia and HerzegovinaBrazilBulgariaBurma/MyanmarCabo VerdeCambodiaCameroonCanadaCaribbeanCentral AmericaChileChinaColombiaCongoCosta RicaCroatiaCubaCzechoslovakiaDenmarkDominicaDominican RepublicEastern AfricaEastern AsiaEastern EuropeEcuadorEgyptEl SalvadorEnglandEritreaEthiopiaEuropeFijiFranceGermanyGhanaGreeceGrenadaGuatemalaGuyanaHaitiHondurasHong KongHungaryIndiaIndonesiaIranIraqIrelandIsraelItalyJamaicaJapanJordanKazakhstanKenyaKoreaKuwaitLaosLatin AmericaLatviaLebanonLiberiaLithuaniaMalaysiaMexicoMicronesiaMiddle AfricaMoldovaMoroccoNepalNetherlandsNicaraguaNigeriaNorth AmericaNorth MacedoniaNorthern AfricaNorthern EuropeNorwayOceaniaPakistanPanamaPeruPhilippinesPolandPortugalRomaniaRussiaSaudi ArabiaScotlandSenegalSerbiaSierra LeoneSingaporeSomaliaSouth AfricaSouth AmericaSouth Central AsiaSouth Eastern AsiaSouthern EuropeSpainSri LankaSt. Vincent and the GrenadinesSudanSwedenSwitzerlandSyriaTaiwanThailandTrinidad and TobagoTurkeyUgandaUkraineUruguayUzbekistanVenezuelaVietnamWest IndiesWestern AfricaWestern AsiaWestern EuropeYemenZaireZimbabweAzores
Russian
Race
Ancestry
AfghanAfricanAlaska NativeAlaskan AthabascanAlbanianAleutAlsatianAmericanApacheArabArapahoArgentineanArmenianAssyrian/Chaldean/SyriacAustralianAustrianBahamianBangladeshiBarbadianBasqueBelgianBelizeanBermudanBhutaneseBlackfeetBolivianBrazilianBritishBritish West IndianBulgarianBurmeseCajunCambodianCanadianCape VerdeanCarpatho RusynCelticCentral AmericanCentral American IndianCherokeeCheyenneChickasawChileanChineseChippewaChoctawColombianColvilleComancheCosta RicanCreeCreekCroatianCrowCubanCypriotCzechCzechoslovakianDanishDelawareDominicanDutchDutch West IndianEastern EuropeanEcuadorianEgyptianEnglishEstonianEthiopianEuropeanFijianFilipinoFinnishFrenchFrench American IndianFrench CanadianGermanGerman RussianGhanaianGreekGuamanian/ChamorroGuatemalanGuyaneseHaitianHmongHonduranHopiHoumaHungarianIcelanderIndian (Asian)IndonesianInupiatIranianIraqiIrishIroquoisIsraeliItalianJamaicanJapaneseJordanianKenyanKiowaKoreanLaotianLatvianLebaneseLiberianLithuanianLumbeeLuxembourgerMacedonianMalaysianMalteseMarshalleseMenomineeMexicanMexican American IndianMongolianMoroccanNative HawaiianNavajoNepaleseNew ZealanderNicaraguanNigerianNorthern EuropeanNorwegianOkinawanOsageOttawaPaiutePakistaniPalestinianPanamanianParaguayanPennsylvania GermanPeruvianPimaPolishPortuguesePotawatomiPuebloPuerto RicanPuget Sound SalishRomanianRussianSalvadoranSamoanScandinavianScotch-IrishScottishSeminoleSenegaleseSerbianShoshoneSierra LeoneanSiouxSlavicSlovakSloveneSomaliSouth AfricanSouth AmericanSouth American IndianSoviet UnionSpaniardSpanishSpanish AmericanSpanish American IndianSri LankanSubsaharan AfricanSudaneseSwedishSwissSyrianTaiwaneseThaiTlingit-HaidaTohono O'OdhamTonganTrinidadian and TobagonianTsimshianTurkishU.S. Virgin IslanderUgandanUkrainianUruguayanUteVenezuelanVietnameseWelshWest IndianYakamaYaquiYugoslavianYumanYup'ikZimbabwean
Immigration
NonimmigrantsImmigrantsAfghanistanAfricaAlbaniaArgentinaArmeniaAsiaAustraliaAustriaBahamasBangladeshBarbadosBelarusBelgiumBelizeBoliviaBosnia and HerzegovinaBrazilBulgariaBurma/MyanmarCabo VerdeCambodiaCameroonCanadaCaribbeanCentral AmericaChileChinaColombiaCongoCosta RicaCroatiaCubaCzechoslovakiaDenmarkDominicaDominican RepublicEastern AfricaEastern AsiaEastern EuropeEcuadorEgyptEl SalvadorEnglandEritreaEthiopiaEuropeFijiFranceGermanyGhanaGreeceGrenadaGuatemalaHaitiHondurasHong KongHungaryIndiaIndonesiaIranIraqIrelandIsraelItalyJamaicaJapanJordanKazakhstanKenyaKoreaKuwaitLaosLatin AmericaLatviaLebanonLiberiaLithuaniaMalaysiaMexicoMicronesiaMiddle AfricaMoldovaMoroccoNepalNetherlandsNicaraguaNigeriaNorth AmericaNorth MacedoniaNorthern AfricaNorthern EuropeNorwayOceaniaPakistanPanamaPeruPhilippinesPolandPortugalRomaniaRussiaSaudi ArabiaScotlandSenegalSerbiaSierra LeoneSingaporeSomaliaSouth AfricaSouth AmericaSouth Central AsiaSouth Eastern AsiaSouthern EuropeSpainSri LankaSt. Vincent and the GrenadinesSudanSwedenSwitzerlandSyriaTaiwanThailandTrinidad and TobagoTurkeyUgandaUkraineUruguayUzbekistanVenezuelaVietnamWest IndiesWestern AfricaWestern AsiaWestern EuropeYemenZaireZimbabweAzores
Householder Income Ages 45 - 64 years
Income
Poverty
Unemployment
Labor Participation
Family Structure
Vehicle Availability
Education Level
Disability

Householder Income Ages 45 - 64 years Comparison

Immigrants from Guyana

Russians

Tragic
Exceptional
$90,186
HOUSEHOLDER INCOME AGES 45 - 64 YEARS
0.6/ 100
METRIC RATING
254th/ 347
METRIC RANK
$116,328
HOUSEHOLDER INCOME AGES 45 - 64 YEARS
100.0/ 100
METRIC RATING
32nd/ 347
METRIC RANK

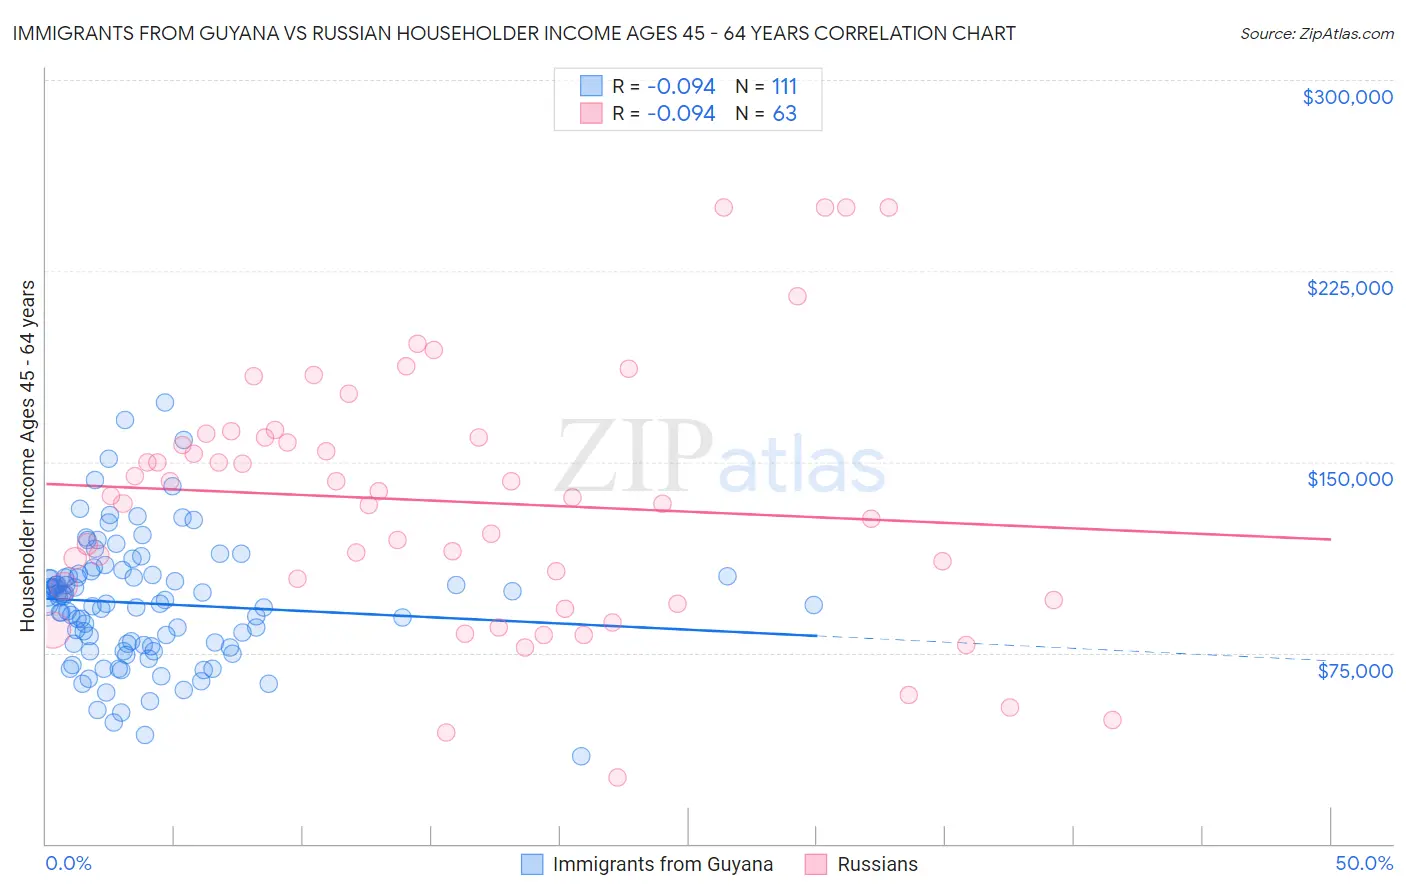
Immigrants from Guyana vs Russian Householder Income Ages 45 - 64 years Correlation Chart

The statistical analysis conducted on geographies consisting of 183,608,154 people shows a slight negative correlation between the proportion of Immigrants from Guyana and household income with householder between the ages 45 and 64 in the United States with a correlation coefficient (R) of -0.094 and weighted average of $90,186. Similarly, the statistical analysis conducted on geographies consisting of 510,398,686 people shows a slight negative correlation between the proportion of Russians and household income with householder between the ages 45 and 64 in the United States with a correlation coefficient (R) of -0.094 and weighted average of $116,328, a difference of 29.0%.
Immigrants from Guyana vs Russian Householder Income Ages 45 - 64 years

Householder Income Ages 45 - 64 years Correlation Summary

MeasurementImmigrants from GuyanaRussian
Minimum$34,531$26,250
Maximum$173,438$250,001
Range$138,907$223,751
Mean$94,395$134,377
Median$94,422$136,249
Interquartile 25% (IQ1)$77,393$95,750
Interquartile 75% (IQ3)$105,417$159,669
Interquartile Range (IQR)$28,024$63,919
Standard Deviation (Sample)$24,856$50,536
Standard Deviation (Population)$24,743$50,133

Similar Demographics by Householder Income Ages 45 - 64 years

Demographics Similar to Immigrants from Guyana by Householder Income Ages 45 - 64 years

In terms of householder income ages 45 - 64 years, the demographic groups most similar to Immigrants from Guyana are Barbadian ($90,266, a difference of 0.090%), Marshallese ($90,455, a difference of 0.30%), West Indian ($89,906, a difference of 0.31%), American ($90,536, a difference of 0.39%), and French American Indian ($89,811, a difference of 0.42%).
DemographicsRating | RankHouseholder Income Ages 45 - 64 years
Alaskan Athabascans
0.9
/100
|
#247
Tragic
$90,951
Immigrants | Laos
0.9
/100
|
#248
Tragic
$90,909
Mexican American Indians
0.8
/100
|
#249
Tragic
$90,811
Sub-Saharan Africans
0.8
/100
|
#250
Tragic
$90,691
Americans
0.7
/100
|
#251
Tragic
$90,536
Marshallese
0.7
/100
|
#252
Tragic
$90,455
Barbadians
0.6
/100
|
#253
Tragic
$90,266
Immigrants | Guyana
0.6
/100
|
#254
Tragic
$90,186
West Indians
0.5
/100
|
#255
Tragic
$89,906
French American Indians
0.5
/100
|
#256
Tragic
$89,811
German Russians
0.4
/100
|
#257
Tragic
$89,398
Immigrants | Barbados
0.4
/100
|
#258
Tragic
$89,394
Immigrants | Nicaragua
0.4
/100
|
#259
Tragic
$89,108
Liberians
0.3
/100
|
#260
Tragic
$88,929
Belizeans
0.3
/100
|
#261
Tragic
$88,684

Demographics Similar to Russians by Householder Income Ages 45 - 64 years

In terms of householder income ages 45 - 64 years, the demographic groups most similar to Russians are Chinese ($116,156, a difference of 0.15%), Immigrants from Asia ($116,566, a difference of 0.20%), Immigrants from Denmark ($116,000, a difference of 0.28%), Latvian ($115,957, a difference of 0.32%), and Immigrants from Switzerland ($115,934, a difference of 0.34%).
DemographicsRating | RankHouseholder Income Ages 45 - 64 years
Asians
100.0
/100
|
#25
Exceptional
$118,426
Immigrants | Sweden
100.0
/100
|
#26
Exceptional
$118,318
Immigrants | Northern Europe
100.0
/100
|
#27
Exceptional
$117,930
Turks
100.0
/100
|
#28
Exceptional
$117,814
Bhutanese
100.0
/100
|
#29
Exceptional
$117,750
Immigrants | Bolivia
100.0
/100
|
#30
Exceptional
$117,731
Immigrants | Asia
100.0
/100
|
#31
Exceptional
$116,566
Russians
100.0
/100
|
#32
Exceptional
$116,328
Chinese
100.0
/100
|
#33
Exceptional
$116,156
Immigrants | Denmark
100.0
/100
|
#34
Exceptional
$116,000
Latvians
100.0
/100
|
#35
Exceptional
$115,957
Immigrants | Switzerland
100.0
/100
|
#36
Exceptional
$115,934
Maltese
99.9
/100
|
#37
Exceptional
$114,754
Immigrants | Pakistan
99.9
/100
|
#38
Exceptional
$114,434
Immigrants | Turkey
99.9
/100
|
#39
Exceptional
$114,407