Immigrants from Greece vs Immigrants from North America Median Earnings
COMPARE
Immigrants from Greece
Immigrants from North America
Median Earnings
Median Earnings Comparison
Immigrants from Greece
Immigrants from North America
$53,282
MEDIAN EARNINGS
100.0/ 100
METRIC RATING
33rd/ 347
METRIC RANK
$50,108
MEDIAN EARNINGS
99.4/ 100
METRIC RATING
89th/ 347
METRIC RANK
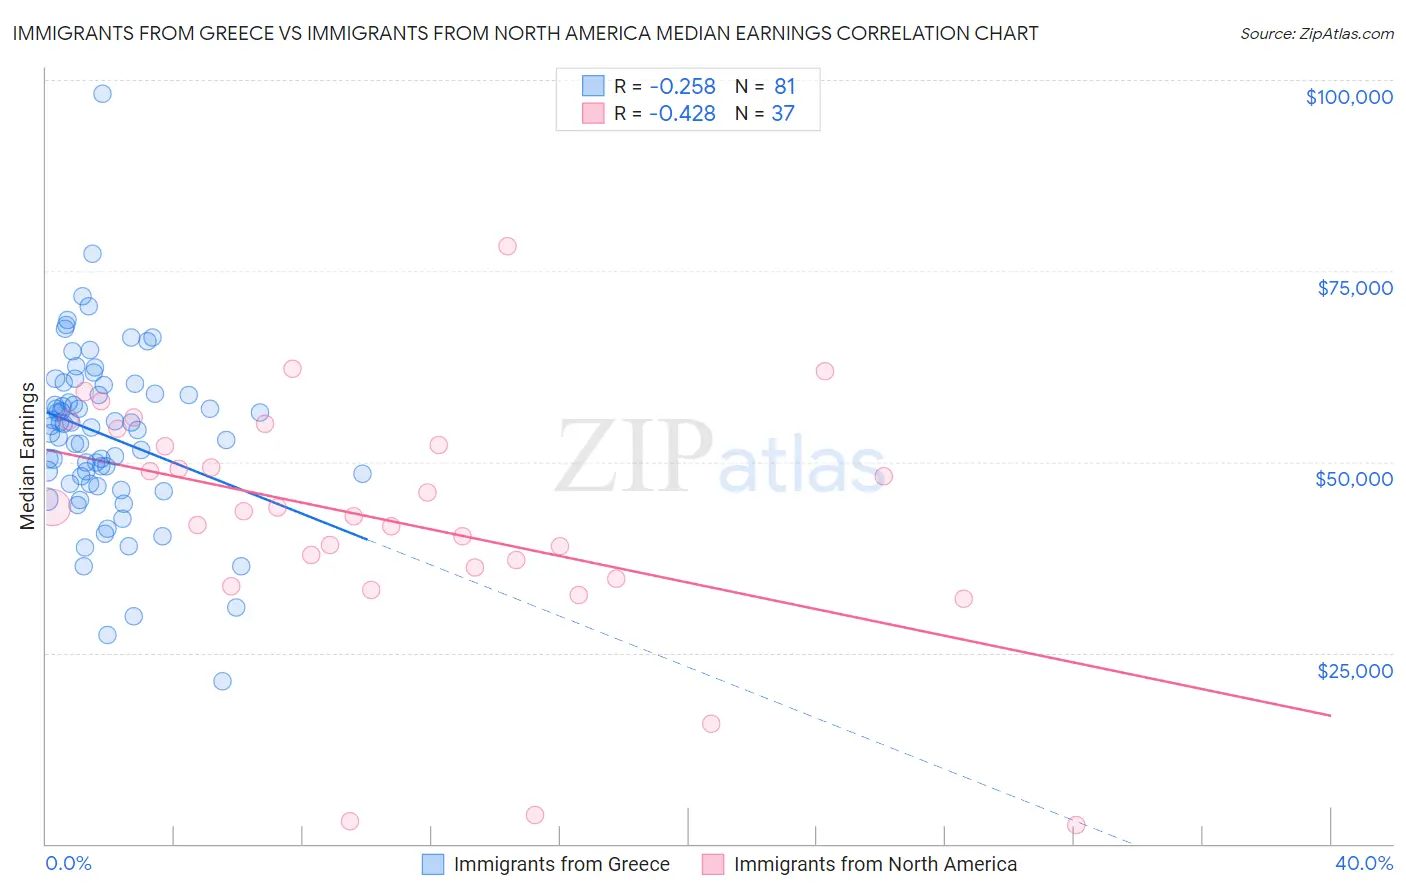
Immigrants from Greece vs Immigrants from North America Median Earnings Correlation Chart
The statistical analysis conducted on geographies consisting of 216,859,908 people shows a weak negative correlation between the proportion of Immigrants from Greece and median earnings in the United States with a correlation coefficient (R) of -0.258 and weighted average of $53,282. Similarly, the statistical analysis conducted on geographies consisting of 462,391,423 people shows a moderate negative correlation between the proportion of Immigrants from North America and median earnings in the United States with a correlation coefficient (R) of -0.428 and weighted average of $50,108, a difference of 6.3%.
Median Earnings Correlation Summary
| Measurement | Immigrants from Greece | Immigrants from North America |
| Minimum | $21,296 | $2,499 |
| Maximum | $98,167 | $78,310 |
| Range | $76,871 | $75,811 |
| Mean | $53,424 | $42,268 |
| Median | $54,495 | $43,536 |
| Interquartile 25% (IQ1) | $47,153 | $35,442 |
| Interquartile 75% (IQ3) | $59,515 | $53,269 |
| Interquartile Range (IQR) | $12,362 | $17,827 |
| Standard Deviation (Sample) | $11,394 | $16,254 |
| Standard Deviation (Population) | $11,323 | $16,033 |
Similar Demographics by Median Earnings
Demographics Similar to Immigrants from Greece by Median Earnings
In terms of median earnings, the demographic groups most similar to Immigrants from Greece are Immigrants from Sri Lanka ($53,268, a difference of 0.030%), Immigrants from Asia ($53,310, a difference of 0.050%), Russian ($53,334, a difference of 0.10%), Immigrants from Switzerland ($53,211, a difference of 0.13%), and Immigrants from Denmark ($53,186, a difference of 0.18%).
| Demographics | Rating | Rank | Median Earnings |
| Immigrants | Northern Europe | 100.0 /100 | #26 | Exceptional $53,872 |
| Asians | 100.0 /100 | #27 | Exceptional $53,690 |
| Immigrants | France | 100.0 /100 | #28 | Exceptional $53,490 |
| Immigrants | Russia | 100.0 /100 | #29 | Exceptional $53,457 |
| Cambodians | 100.0 /100 | #30 | Exceptional $53,386 |
| Russians | 100.0 /100 | #31 | Exceptional $53,334 |
| Immigrants | Asia | 100.0 /100 | #32 | Exceptional $53,310 |
| Immigrants | Greece | 100.0 /100 | #33 | Exceptional $53,282 |
| Immigrants | Sri Lanka | 100.0 /100 | #34 | Exceptional $53,268 |
| Immigrants | Switzerland | 100.0 /100 | #35 | Exceptional $53,211 |
| Immigrants | Denmark | 100.0 /100 | #36 | Exceptional $53,186 |
| Immigrants | Belarus | 100.0 /100 | #37 | Exceptional $53,043 |
| Latvians | 100.0 /100 | #38 | Exceptional $53,001 |
| Immigrants | Turkey | 100.0 /100 | #39 | Exceptional $52,960 |
| Israelis | 100.0 /100 | #40 | Exceptional $52,937 |
Demographics Similar to Immigrants from North America by Median Earnings
In terms of median earnings, the demographic groups most similar to Immigrants from North America are Albanian ($50,116, a difference of 0.020%), Immigrants from Uzbekistan ($50,151, a difference of 0.090%), Immigrants from Canada ($50,192, a difference of 0.17%), Immigrants from Kazakhstan ($50,225, a difference of 0.23%), and Immigrants from Hungary ($50,227, a difference of 0.24%).
| Demographics | Rating | Rank | Median Earnings |
| Immigrants | Moldova | 99.5 /100 | #82 | Exceptional $50,274 |
| Romanians | 99.5 /100 | #83 | Exceptional $50,244 |
| Immigrants | Hungary | 99.5 /100 | #84 | Exceptional $50,227 |
| Immigrants | Kazakhstan | 99.5 /100 | #85 | Exceptional $50,225 |
| Immigrants | Canada | 99.5 /100 | #86 | Exceptional $50,192 |
| Immigrants | Uzbekistan | 99.5 /100 | #87 | Exceptional $50,151 |
| Albanians | 99.4 /100 | #88 | Exceptional $50,116 |
| Immigrants | North America | 99.4 /100 | #89 | Exceptional $50,108 |
| Italians | 99.3 /100 | #90 | Exceptional $49,915 |
| Macedonians | 99.2 /100 | #91 | Exceptional $49,893 |
| Immigrants | Argentina | 99.2 /100 | #92 | Exceptional $49,841 |
| Armenians | 99.1 /100 | #93 | Exceptional $49,804 |
| Croatians | 99.0 /100 | #94 | Exceptional $49,724 |
| Immigrants | England | 99.0 /100 | #95 | Exceptional $49,722 |
| Immigrants | Lebanon | 99.0 /100 | #96 | Exceptional $49,682 |