Immigrants from Greece vs Chinese Median Family Income
COMPARE
Immigrants from Greece
Chinese
Median Family Income
Median Family Income Comparison
Immigrants from Greece
Chinese
$117,344
MEDIAN FAMILY INCOME
99.9/ 100
METRIC RATING
45th/ 347
METRIC RANK
$116,188
MEDIAN FAMILY INCOME
99.9/ 100
METRIC RATING
49th/ 347
METRIC RANK
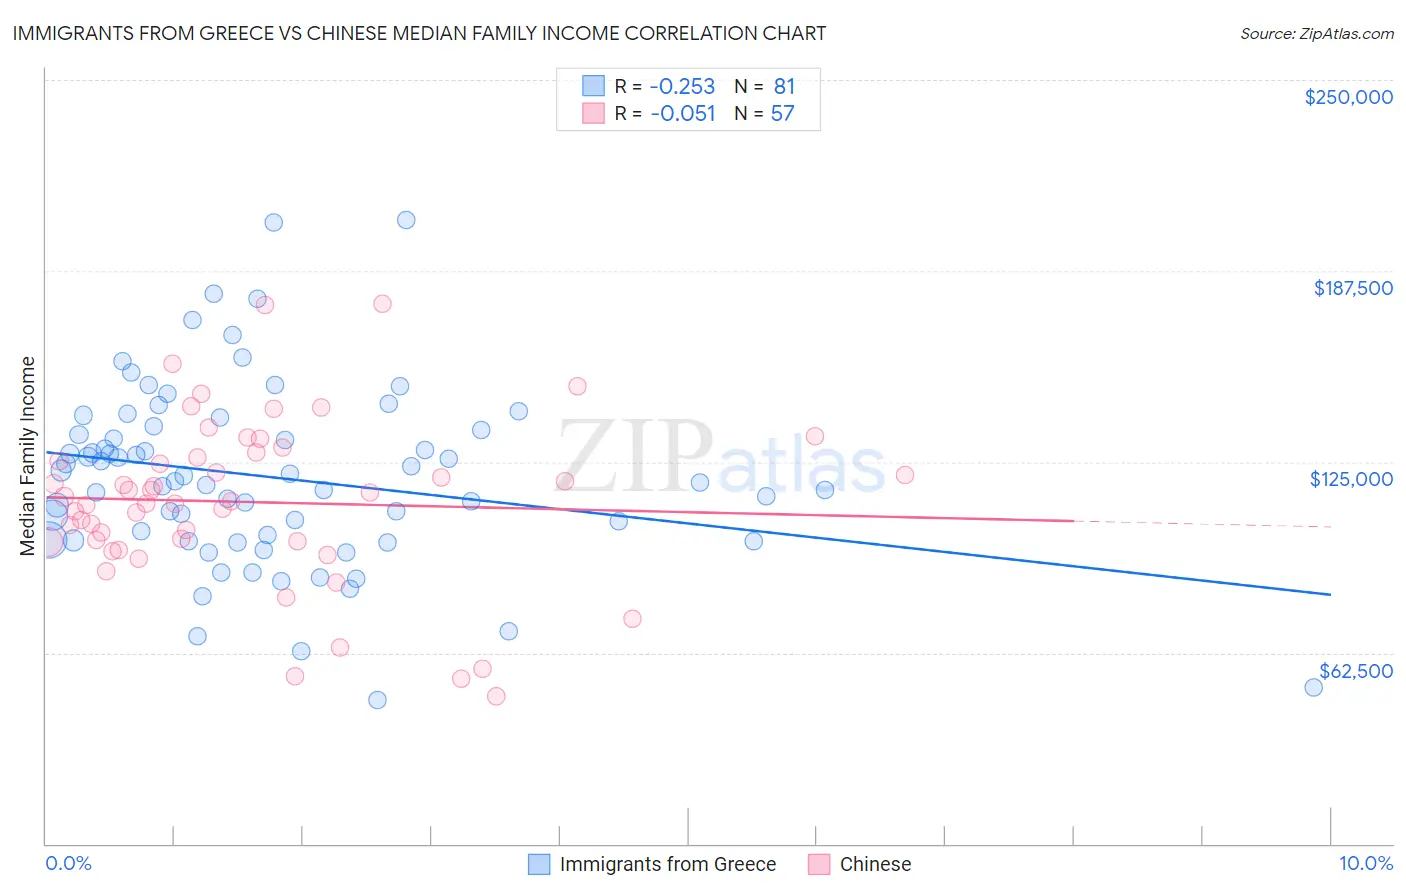
Immigrants from Greece vs Chinese Median Family Income Correlation Chart
The statistical analysis conducted on geographies consisting of 216,841,936 people shows a weak negative correlation between the proportion of Immigrants from Greece and median family income in the United States with a correlation coefficient (R) of -0.253 and weighted average of $117,344. Similarly, the statistical analysis conducted on geographies consisting of 64,799,903 people shows a slight negative correlation between the proportion of Chinese and median family income in the United States with a correlation coefficient (R) of -0.051 and weighted average of $116,188, a difference of 0.99%.
Median Family Income Correlation Summary
| Measurement | Immigrants from Greece | Chinese |
| Minimum | $46,875 | $48,295 |
| Maximum | $204,250 | $176,564 |
| Range | $157,375 | $128,269 |
| Mean | $119,942 | $111,811 |
| Median | $118,534 | $112,252 |
| Interquartile 25% (IQ1) | $99,330 | $98,862 |
| Interquartile 75% (IQ3) | $136,059 | $127,363 |
| Interquartile Range (IQR) | $36,729 | $28,501 |
| Standard Deviation (Sample) | $29,797 | $27,086 |
| Standard Deviation (Population) | $29,612 | $26,847 |
Demographics Similar to Immigrants from Greece and Chinese by Median Family Income
In terms of median family income, the demographic groups most similar to Immigrants from Greece are Immigrants from Russia ($116,942, a difference of 0.34%), Cambodian ($117,780, a difference of 0.37%), Bulgarian ($117,818, a difference of 0.40%), Immigrants from Austria ($116,830, a difference of 0.44%), and Immigrants from Bolivia ($117,912, a difference of 0.48%). Similarly, the demographic groups most similar to Chinese are Immigrants from Czechoslovakia ($116,165, a difference of 0.020%), Immigrants from South Africa ($116,286, a difference of 0.080%), Immigrants from Malaysia ($115,880, a difference of 0.27%), Maltese ($115,862, a difference of 0.28%), and Immigrants from Norway ($115,847, a difference of 0.29%).
| Demographics | Rating | Rank | Median Family Income |
| Australians | 100.0 /100 | #37 | Exceptional $118,440 |
| Immigrants | Turkey | 100.0 /100 | #38 | Exceptional $118,325 |
| Immigrants | Asia | 100.0 /100 | #39 | Exceptional $118,291 |
| Immigrants | Lithuania | 100.0 /100 | #40 | Exceptional $118,053 |
| Estonians | 100.0 /100 | #41 | Exceptional $118,013 |
| Immigrants | Bolivia | 100.0 /100 | #42 | Exceptional $117,912 |
| Bulgarians | 100.0 /100 | #43 | Exceptional $117,818 |
| Cambodians | 100.0 /100 | #44 | Exceptional $117,780 |
| Immigrants | Greece | 99.9 /100 | #45 | Exceptional $117,344 |
| Immigrants | Russia | 99.9 /100 | #46 | Exceptional $116,942 |
| Immigrants | Austria | 99.9 /100 | #47 | Exceptional $116,830 |
| Immigrants | South Africa | 99.9 /100 | #48 | Exceptional $116,286 |
| Chinese | 99.9 /100 | #49 | Exceptional $116,188 |
| Immigrants | Czechoslovakia | 99.9 /100 | #50 | Exceptional $116,165 |
| Immigrants | Malaysia | 99.9 /100 | #51 | Exceptional $115,880 |
| Maltese | 99.9 /100 | #52 | Exceptional $115,862 |
| Immigrants | Norway | 99.9 /100 | #53 | Exceptional $115,847 |
| Immigrants | Europe | 99.9 /100 | #54 | Exceptional $115,523 |
| Lithuanians | 99.8 /100 | #55 | Exceptional $115,395 |
| New Zealanders | 99.8 /100 | #56 | Exceptional $115,230 |
| Greeks | 99.8 /100 | #57 | Exceptional $115,192 |