Immigrants from Germany vs Latvian Householder Income Ages 45 - 64 years

COMPARE

Immigrants from Germany
Race
Ancestry
AfghanAfricanAlaska NativeAlaskan AthabascanAlbanianAleutAlsatianAmericanApacheArabArapahoArgentineanArmenianAssyrian/Chaldean/SyriacAustralianAustrianBahamianBangladeshiBarbadianBasqueBelgianBelizeanBermudanBhutaneseBlackfeetBolivianBrazilianBritishBritish West IndianBulgarianBurmeseCajunCambodianCanadianCape VerdeanCarpatho RusynCelticCentral AmericanCentral American IndianCherokeeCheyenneChickasawChileanChineseChippewaChoctawColombianColvilleComancheCosta RicanCreeCreekCroatianCrowCubanCypriotCzechCzechoslovakianDanishDelawareDominicanDutchDutch West IndianEastern EuropeanEcuadorianEgyptianEnglishEstonianEthiopianEuropeanFijianFilipinoFinnishFrenchFrench American IndianFrench CanadianGermanGerman RussianGhanaianGreekGuamanian/ChamorroGuatemalanGuyaneseHaitianHmongHonduranHopiHoumaHungarianIcelanderIndian (Asian)IndonesianInupiatIranianIraqiIrishIroquoisIsraeliItalianJamaicanJapaneseJordanianKenyanKiowaKoreanLaotianLebaneseLiberianLithuanianLumbeeLuxembourgerMacedonianMalaysianMalteseMarshalleseMenomineeMexicanMexican American IndianMongolianMoroccanNative HawaiianNavajoNepaleseNew ZealanderNicaraguanNigerianNorthern EuropeanNorwegianOkinawanOsageOttawaPaiutePakistaniPalestinianPanamanianParaguayanPennsylvania GermanPeruvianPimaPolishPortuguesePotawatomiPuebloPuerto RicanPuget Sound SalishRomanianRussianSalvadoranSamoanScandinavianScotch-IrishScottishSeminoleSenegaleseSerbianShoshoneSierra LeoneanSiouxSlavicSlovakSloveneSomaliSouth AfricanSouth AmericanSouth American IndianSoviet UnionSpaniardSpanishSpanish AmericanSpanish American IndianSri LankanSubsaharan AfricanSudaneseSwedishSwissSyrianTaiwaneseThaiTlingit-HaidaTohono O'OdhamTonganTrinidadian and TobagonianTsimshianTurkishU.S. Virgin IslanderUgandanUkrainianUruguayanUteVenezuelanVietnameseWelshWest IndianYakamaYaquiYugoslavianYumanYup'ikZimbabwean
Immigration
NonimmigrantsImmigrantsAfghanistanAfricaAlbaniaArgentinaArmeniaAsiaAustraliaAustriaBahamasBangladeshBarbadosBelarusBelgiumBelizeBoliviaBosnia and HerzegovinaBrazilBulgariaBurma/MyanmarCabo VerdeCambodiaCameroonCanadaCaribbeanCentral AmericaChileChinaColombiaCongoCosta RicaCroatiaCubaCzechoslovakiaDenmarkDominicaDominican RepublicEastern AfricaEastern AsiaEastern EuropeEcuadorEgyptEl SalvadorEnglandEritreaEthiopiaEuropeFijiFranceGermanyGhanaGreeceGrenadaGuatemalaGuyanaHaitiHondurasHong KongHungaryIndiaIndonesiaIranIraqIrelandIsraelItalyJamaicaJapanJordanKazakhstanKenyaKoreaKuwaitLaosLatin AmericaLatviaLebanonLiberiaLithuaniaMalaysiaMexicoMicronesiaMiddle AfricaMoldovaMoroccoNepalNetherlandsNicaraguaNigeriaNorth AmericaNorth MacedoniaNorthern AfricaNorthern EuropeNorwayOceaniaPakistanPanamaPeruPhilippinesPolandPortugalRomaniaRussiaSaudi ArabiaScotlandSenegalSerbiaSierra LeoneSingaporeSomaliaSouth AfricaSouth AmericaSouth Central AsiaSouth Eastern AsiaSouthern EuropeSpainSri LankaSt. Vincent and the GrenadinesSudanSwedenSwitzerlandSyriaTaiwanThailandTrinidad and TobagoTurkeyUgandaUkraineUruguayUzbekistanVenezuelaVietnamWest IndiesWestern AfricaWestern AsiaWestern EuropeYemenZaireZimbabweAzores
Latvian
Race
Ancestry
AfghanAfricanAlaska NativeAlaskan AthabascanAlbanianAleutAlsatianAmericanApacheArabArapahoArgentineanArmenianAssyrian/Chaldean/SyriacAustralianAustrianBahamianBangladeshiBarbadianBasqueBelgianBelizeanBermudanBhutaneseBlackfeetBolivianBrazilianBritishBritish West IndianBulgarianBurmeseCajunCambodianCanadianCape VerdeanCarpatho RusynCelticCentral AmericanCentral American IndianCherokeeCheyenneChickasawChileanChineseChippewaChoctawColombianColvilleComancheCosta RicanCreeCreekCroatianCrowCubanCypriotCzechCzechoslovakianDanishDelawareDominicanDutchDutch West IndianEastern EuropeanEcuadorianEgyptianEnglishEstonianEthiopianEuropeanFijianFilipinoFinnishFrenchFrench American IndianFrench CanadianGermanGerman RussianGhanaianGreekGuamanian/ChamorroGuatemalanGuyaneseHaitianHmongHonduranHopiHoumaHungarianIcelanderIndian (Asian)IndonesianInupiatIranianIraqiIrishIroquoisIsraeliItalianJamaicanJapaneseJordanianKenyanKiowaKoreanLaotianLatvianLebaneseLiberianLithuanianLumbeeLuxembourgerMacedonianMalaysianMalteseMarshalleseMenomineeMexicanMexican American IndianMongolianMoroccanNative HawaiianNavajoNepaleseNew ZealanderNicaraguanNigerianNorthern EuropeanNorwegianOkinawanOsageOttawaPaiutePakistaniPalestinianPanamanianParaguayanPennsylvania GermanPeruvianPimaPolishPortuguesePotawatomiPuebloPuerto RicanPuget Sound SalishRomanianRussianSalvadoranSamoanScandinavianScotch-IrishScottishSeminoleSenegaleseSerbianShoshoneSierra LeoneanSiouxSlavicSlovakSloveneSomaliSouth AfricanSouth AmericanSouth American IndianSoviet UnionSpaniardSpanishSpanish AmericanSpanish American IndianSri LankanSubsaharan AfricanSudaneseSwedishSwissSyrianTaiwaneseThaiTlingit-HaidaTohono O'OdhamTonganTrinidadian and TobagonianTsimshianTurkishU.S. Virgin IslanderUgandanUkrainianUruguayanUteVenezuelanVietnameseWelshWest IndianYakamaYaquiYugoslavianYumanYup'ikZimbabwean
Immigration
NonimmigrantsImmigrantsAfghanistanAfricaAlbaniaArgentinaArmeniaAsiaAustraliaAustriaBahamasBangladeshBarbadosBelarusBelgiumBelizeBoliviaBosnia and HerzegovinaBrazilBulgariaBurma/MyanmarCabo VerdeCambodiaCameroonCanadaCaribbeanCentral AmericaChileChinaColombiaCongoCosta RicaCroatiaCubaCzechoslovakiaDenmarkDominicaDominican RepublicEastern AfricaEastern AsiaEastern EuropeEcuadorEgyptEl SalvadorEnglandEritreaEthiopiaEuropeFijiFranceGhanaGreeceGrenadaGuatemalaGuyanaHaitiHondurasHong KongHungaryIndiaIndonesiaIranIraqIrelandIsraelItalyJamaicaJapanJordanKazakhstanKenyaKoreaKuwaitLaosLatin AmericaLatviaLebanonLiberiaLithuaniaMalaysiaMexicoMicronesiaMiddle AfricaMoldovaMoroccoNepalNetherlandsNicaraguaNigeriaNorth AmericaNorth MacedoniaNorthern AfricaNorthern EuropeNorwayOceaniaPakistanPanamaPeruPhilippinesPolandPortugalRomaniaRussiaSaudi ArabiaScotlandSenegalSerbiaSierra LeoneSingaporeSomaliaSouth AfricaSouth AmericaSouth Central AsiaSouth Eastern AsiaSouthern EuropeSpainSri LankaSt. Vincent and the GrenadinesSudanSwedenSwitzerlandSyriaTaiwanThailandTrinidad and TobagoTurkeyUgandaUkraineUruguayUzbekistanVenezuelaVietnamWest IndiesWestern AfricaWestern AsiaWestern EuropeYemenZaireZimbabweAzores
Householder Income Ages 45 - 64 years
Income
Poverty
Unemployment
Labor Participation
Family Structure
Vehicle Availability
Education Level
Disability

Householder Income Ages 45 - 64 years Comparison

Immigrants from Germany

Latvians

Excellent
Exceptional
$103,282
HOUSEHOLDER INCOME AGES 45 - 64 YEARS
81.5/ 100
METRIC RATING
148th/ 347
METRIC RANK
$115,957
HOUSEHOLDER INCOME AGES 45 - 64 YEARS
100.0/ 100
METRIC RATING
35th/ 347
METRIC RANK

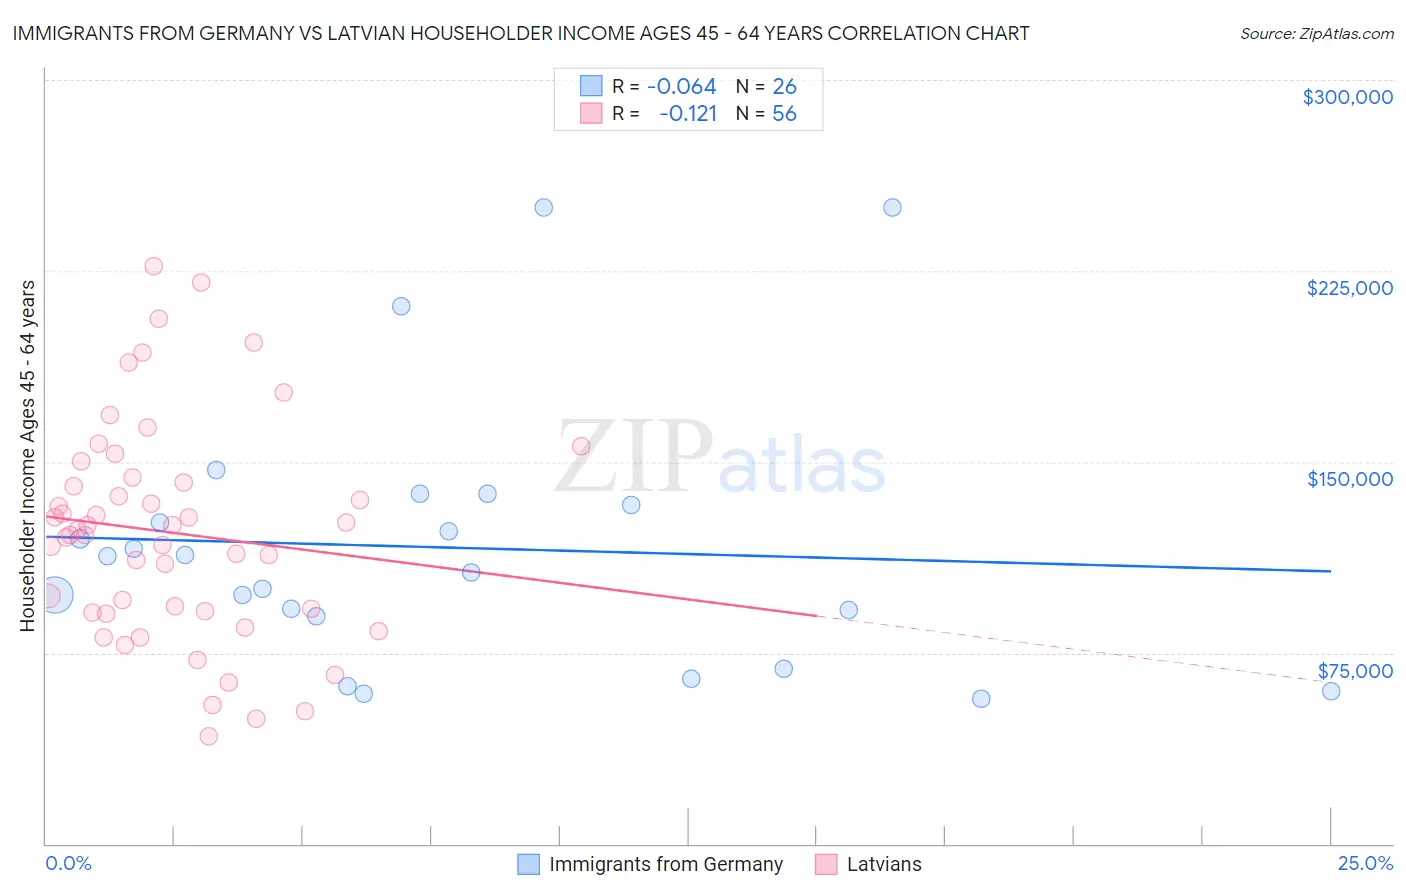
Immigrants from Germany vs Latvian Householder Income Ages 45 - 64 years Correlation Chart

The statistical analysis conducted on geographies consisting of 463,046,856 people shows a slight negative correlation between the proportion of Immigrants from Germany and household income with householder between the ages 45 and 64 in the United States with a correlation coefficient (R) of -0.064 and weighted average of $103,282. Similarly, the statistical analysis conducted on geographies consisting of 220,551,623 people shows a poor negative correlation between the proportion of Latvians and household income with householder between the ages 45 and 64 in the United States with a correlation coefficient (R) of -0.121 and weighted average of $115,957, a difference of 12.3%.
Immigrants from Germany vs Latvian Householder Income Ages 45 - 64 years

Householder Income Ages 45 - 64 years Correlation Summary

MeasurementImmigrants from GermanyLatvian
Minimum$56,731$42,308
Maximum$250,001$227,065
Range$193,270$184,757
Mean$116,317$122,178
Median$109,777$122,376
Interquartile 25% (IQ1)$89,417$90,966
Interquartile 75% (IQ3)$133,088$143,031
Interquartile Range (IQR)$43,671$52,065
Standard Deviation (Sample)$52,104$42,820
Standard Deviation (Population)$51,092$42,436

Similar Demographics by Householder Income Ages 45 - 64 years

Demographics Similar to Immigrants from Germany by Householder Income Ages 45 - 64 years

In terms of householder income ages 45 - 64 years, the demographic groups most similar to Immigrants from Germany are Immigrants from Sierra Leone ($103,227, a difference of 0.050%), Basque ($103,387, a difference of 0.10%), Immigrants from Peru ($103,173, a difference of 0.11%), Immigrants from Chile ($103,412, a difference of 0.13%), and Ugandan ($103,472, a difference of 0.18%).
DemographicsRating | RankHouseholder Income Ages 45 - 64 years
Immigrants | Uganda
83.7
/100
|
#141
Excellent
$103,584
Luxembourgers
83.3
/100
|
#142
Excellent
$103,536
Serbians
83.2
/100
|
#143
Excellent
$103,522
Czechs
83.1
/100
|
#144
Excellent
$103,507
Ugandans
82.9
/100
|
#145
Excellent
$103,472
Immigrants | Chile
82.5
/100
|
#146
Excellent
$103,412
Basques
82.3
/100
|
#147
Excellent
$103,387
Immigrants | Germany
81.5
/100
|
#148
Excellent
$103,282
Immigrants | Sierra Leone
81.1
/100
|
#149
Excellent
$103,227
Immigrants | Peru
80.7
/100
|
#150
Excellent
$103,173
Swiss
79.9
/100
|
#151
Good
$103,071
Irish
79.8
/100
|
#152
Good
$103,067
Scandinavians
79.0
/100
|
#153
Good
$102,969
Slovenes
78.3
/100
|
#154
Good
$102,885
Costa Ricans
77.4
/100
|
#155
Good
$102,779

Demographics Similar to Latvians by Householder Income Ages 45 - 64 years

In terms of householder income ages 45 - 64 years, the demographic groups most similar to Latvians are Immigrants from Switzerland ($115,934, a difference of 0.020%), Immigrants from Denmark ($116,000, a difference of 0.040%), Chinese ($116,156, a difference of 0.17%), Russian ($116,328, a difference of 0.32%), and Immigrants from Asia ($116,566, a difference of 0.53%).
DemographicsRating | RankHouseholder Income Ages 45 - 64 years
Turks
100.0
/100
|
#28
Exceptional
$117,814
Bhutanese
100.0
/100
|
#29
Exceptional
$117,750
Immigrants | Bolivia
100.0
/100
|
#30
Exceptional
$117,731
Immigrants | Asia
100.0
/100
|
#31
Exceptional
$116,566
Russians
100.0
/100
|
#32
Exceptional
$116,328
Chinese
100.0
/100
|
#33
Exceptional
$116,156
Immigrants | Denmark
100.0
/100
|
#34
Exceptional
$116,000
Latvians
100.0
/100
|
#35
Exceptional
$115,957
Immigrants | Switzerland
100.0
/100
|
#36
Exceptional
$115,934
Maltese
99.9
/100
|
#37
Exceptional
$114,754
Immigrants | Pakistan
99.9
/100
|
#38
Exceptional
$114,434
Immigrants | Turkey
99.9
/100
|
#39
Exceptional
$114,407
Cambodians
99.9
/100
|
#40
Exceptional
$114,342
Immigrants | Lithuania
99.9
/100
|
#41
Exceptional
$114,336
Estonians
99.9
/100
|
#42
Exceptional
$114,220