Immigrants from Europe vs French Householder Income Ages 45 - 64 years

COMPARE

Immigrants from Europe
Race
Ancestry
AfghanAfricanAlaska NativeAlaskan AthabascanAlbanianAleutAlsatianAmericanApacheArabArapahoArgentineanArmenianAssyrian/Chaldean/SyriacAustralianAustrianBahamianBangladeshiBarbadianBasqueBelgianBelizeanBermudanBhutaneseBlackfeetBolivianBrazilianBritishBritish West IndianBulgarianBurmeseCajunCambodianCanadianCape VerdeanCarpatho RusynCelticCentral AmericanCentral American IndianCherokeeCheyenneChickasawChileanChineseChippewaChoctawColombianColvilleComancheCosta RicanCreeCreekCroatianCrowCubanCypriotCzechCzechoslovakianDanishDelawareDominicanDutchDutch West IndianEastern EuropeanEcuadorianEgyptianEnglishEstonianEthiopianEuropeanFijianFilipinoFinnishFrench American IndianFrench CanadianGermanGerman RussianGhanaianGreekGuamanian/ChamorroGuatemalanGuyaneseHaitianHmongHonduranHopiHoumaHungarianIcelanderIndian (Asian)IndonesianInupiatIranianIraqiIrishIroquoisIsraeliItalianJamaicanJapaneseJordanianKenyanKiowaKoreanLaotianLatvianLebaneseLiberianLithuanianLumbeeLuxembourgerMacedonianMalaysianMalteseMarshalleseMenomineeMexicanMexican American IndianMongolianMoroccanNative HawaiianNavajoNepaleseNew ZealanderNicaraguanNigerianNorthern EuropeanNorwegianOkinawanOsageOttawaPaiutePakistaniPalestinianPanamanianParaguayanPennsylvania GermanPeruvianPimaPolishPortuguesePotawatomiPuebloPuerto RicanPuget Sound SalishRomanianRussianSalvadoranSamoanScandinavianScotch-IrishScottishSeminoleSenegaleseSerbianShoshoneSierra LeoneanSiouxSlavicSlovakSloveneSomaliSouth AfricanSouth AmericanSouth American IndianSoviet UnionSpaniardSpanishSpanish AmericanSpanish American IndianSri LankanSubsaharan AfricanSudaneseSwedishSwissSyrianTaiwaneseThaiTlingit-HaidaTohono O'OdhamTonganTrinidadian and TobagonianTsimshianTurkishU.S. Virgin IslanderUgandanUkrainianUruguayanUteVenezuelanVietnameseWelshWest IndianYakamaYaquiYugoslavianYumanYup'ikZimbabwean
Immigration
NonimmigrantsImmigrantsAfghanistanAfricaAlbaniaArgentinaArmeniaAsiaAustraliaAustriaBahamasBangladeshBarbadosBelarusBelgiumBelizeBoliviaBosnia and HerzegovinaBrazilBulgariaBurma/MyanmarCabo VerdeCambodiaCameroonCanadaCaribbeanCentral AmericaChileChinaColombiaCongoCosta RicaCroatiaCubaCzechoslovakiaDenmarkDominicaDominican RepublicEastern AfricaEastern AsiaEastern EuropeEcuadorEgyptEl SalvadorEnglandEritreaEthiopiaEuropeFijiFranceGermanyGhanaGreeceGrenadaGuatemalaGuyanaHaitiHondurasHong KongHungaryIndiaIndonesiaIranIraqIrelandIsraelItalyJamaicaJapanJordanKazakhstanKenyaKoreaKuwaitLaosLatin AmericaLatviaLebanonLiberiaLithuaniaMalaysiaMexicoMicronesiaMiddle AfricaMoldovaMoroccoNepalNetherlandsNicaraguaNigeriaNorth AmericaNorth MacedoniaNorthern AfricaNorthern EuropeNorwayOceaniaPakistanPanamaPeruPhilippinesPolandPortugalRomaniaRussiaSaudi ArabiaScotlandSenegalSerbiaSierra LeoneSingaporeSomaliaSouth AfricaSouth AmericaSouth Central AsiaSouth Eastern AsiaSouthern EuropeSpainSri LankaSt. Vincent and the GrenadinesSudanSwedenSwitzerlandSyriaTaiwanThailandTrinidad and TobagoTurkeyUgandaUkraineUruguayUzbekistanVenezuelaVietnamWest IndiesWestern AfricaWestern AsiaWestern EuropeYemenZaireZimbabweAzores
French
Race
Ancestry
AfghanAfricanAlaska NativeAlaskan AthabascanAlbanianAleutAlsatianAmericanApacheArabArapahoArgentineanArmenianAssyrian/Chaldean/SyriacAustralianAustrianBahamianBangladeshiBarbadianBasqueBelgianBelizeanBermudanBhutaneseBlackfeetBolivianBrazilianBritishBritish West IndianBulgarianBurmeseCajunCambodianCanadianCape VerdeanCarpatho RusynCelticCentral AmericanCentral American IndianCherokeeCheyenneChickasawChileanChineseChippewaChoctawColombianColvilleComancheCosta RicanCreeCreekCroatianCrowCubanCypriotCzechCzechoslovakianDanishDelawareDominicanDutchDutch West IndianEastern EuropeanEcuadorianEgyptianEnglishEstonianEthiopianEuropeanFijianFilipinoFinnishFrenchFrench American IndianFrench CanadianGermanGerman RussianGhanaianGreekGuamanian/ChamorroGuatemalanGuyaneseHaitianHmongHonduranHopiHoumaHungarianIcelanderIndian (Asian)IndonesianInupiatIranianIraqiIrishIroquoisIsraeliItalianJamaicanJapaneseJordanianKenyanKiowaKoreanLaotianLatvianLebaneseLiberianLithuanianLumbeeLuxembourgerMacedonianMalaysianMalteseMarshalleseMenomineeMexicanMexican American IndianMongolianMoroccanNative HawaiianNavajoNepaleseNew ZealanderNicaraguanNigerianNorthern EuropeanNorwegianOkinawanOsageOttawaPaiutePakistaniPalestinianPanamanianParaguayanPennsylvania GermanPeruvianPimaPolishPortuguesePotawatomiPuebloPuerto RicanPuget Sound SalishRomanianRussianSalvadoranSamoanScandinavianScotch-IrishScottishSeminoleSenegaleseSerbianShoshoneSierra LeoneanSiouxSlavicSlovakSloveneSomaliSouth AfricanSouth AmericanSouth American IndianSoviet UnionSpaniardSpanishSpanish AmericanSpanish American IndianSri LankanSubsaharan AfricanSudaneseSwedishSwissSyrianTaiwaneseThaiTlingit-HaidaTohono O'OdhamTonganTrinidadian and TobagonianTsimshianTurkishU.S. Virgin IslanderUgandanUkrainianUruguayanUteVenezuelanVietnameseWelshWest IndianYakamaYaquiYugoslavianYumanYup'ikZimbabwean
Immigration
NonimmigrantsImmigrantsAfghanistanAfricaAlbaniaArgentinaArmeniaAsiaAustraliaAustriaBahamasBangladeshBarbadosBelarusBelgiumBelizeBoliviaBosnia and HerzegovinaBrazilBulgariaBurma/MyanmarCabo VerdeCambodiaCameroonCanadaCaribbeanCentral AmericaChileChinaColombiaCongoCosta RicaCroatiaCubaCzechoslovakiaDenmarkDominicaDominican RepublicEastern AfricaEastern AsiaEastern EuropeEcuadorEgyptEl SalvadorEnglandEritreaEthiopiaFijiFranceGermanyGhanaGreeceGrenadaGuatemalaGuyanaHaitiHondurasHong KongHungaryIndiaIndonesiaIranIraqIrelandIsraelItalyJamaicaJapanJordanKazakhstanKenyaKoreaKuwaitLaosLatin AmericaLatviaLebanonLiberiaLithuaniaMalaysiaMexicoMicronesiaMiddle AfricaMoldovaMoroccoNepalNetherlandsNicaraguaNigeriaNorth AmericaNorth MacedoniaNorthern AfricaNorthern EuropeNorwayOceaniaPakistanPanamaPeruPhilippinesPolandPortugalRomaniaRussiaSaudi ArabiaScotlandSenegalSerbiaSierra LeoneSingaporeSomaliaSouth AfricaSouth AmericaSouth Central AsiaSouth Eastern AsiaSouthern EuropeSpainSri LankaSt. Vincent and the GrenadinesSudanSwedenSwitzerlandSyriaTaiwanThailandTrinidad and TobagoTurkeyUgandaUkraineUruguayUzbekistanVenezuelaVietnamWest IndiesWestern AfricaWestern AsiaWestern EuropeYemenZaireZimbabweAzores
Householder Income Ages 45 - 64 years
Income
Poverty
Unemployment
Labor Participation
Family Structure
Vehicle Availability
Education Level
Disability

Householder Income Ages 45 - 64 years Comparison

Immigrants from Europe

French

Exceptional
Average
$111,984
HOUSEHOLDER INCOME AGES 45 - 64 YEARS
99.7/ 100
METRIC RATING
59th/ 347
METRIC RANK
$99,824
HOUSEHOLDER INCOME AGES 45 - 64 YEARS
43.8/ 100
METRIC RATING
184th/ 347
METRIC RANK

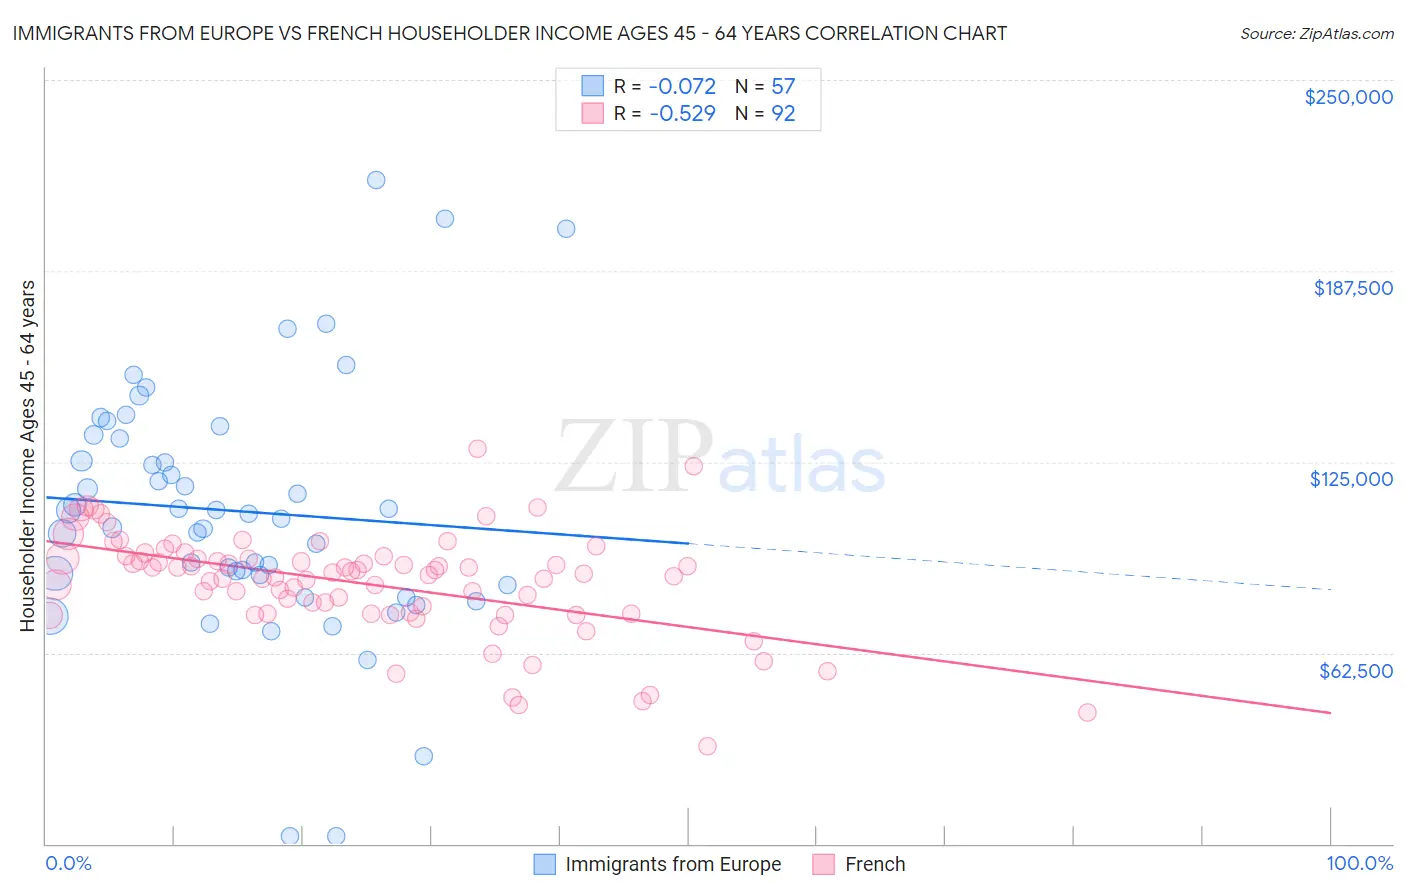
Immigrants from Europe vs French Householder Income Ages 45 - 64 years Correlation Chart

The statistical analysis conducted on geographies consisting of 544,996,664 people shows a slight negative correlation between the proportion of Immigrants from Europe and household income with householder between the ages 45 and 64 in the United States with a correlation coefficient (R) of -0.072 and weighted average of $111,984. Similarly, the statistical analysis conducted on geographies consisting of 568,632,779 people shows a substantial negative correlation between the proportion of French and household income with householder between the ages 45 and 64 in the United States with a correlation coefficient (R) of -0.529 and weighted average of $99,824, a difference of 12.2%.
Immigrants from Europe vs French Householder Income Ages 45 - 64 years

Householder Income Ages 45 - 64 years Correlation Summary

MeasurementImmigrants from EuropeFrench
Minimum$2,499$32,031
Maximum$217,188$129,396
Range$214,689$97,365
Mean$108,826$85,264
Median$107,861$88,490
Interquartile 25% (IQ1)$86,440$75,583
Interquartile 75% (IQ3)$133,222$93,777
Interquartile Range (IQR)$46,781$18,194
Standard Deviation (Sample)$41,229$17,163
Standard Deviation (Population)$40,866$17,070

Similar Demographics by Householder Income Ages 45 - 64 years

Demographics Similar to Immigrants from Europe by Householder Income Ages 45 - 64 years

In terms of householder income ages 45 - 64 years, the demographic groups most similar to Immigrants from Europe are Immigrants from Netherlands ($111,982, a difference of 0.0%), Soviet Union ($112,008, a difference of 0.020%), Immigrants from Czechoslovakia ($111,914, a difference of 0.060%), Immigrants from Scotland ($112,175, a difference of 0.17%), and Egyptian ($112,256, a difference of 0.24%).
DemographicsRating | RankHouseholder Income Ages 45 - 64 years
Immigrants | Malaysia
99.8
/100
|
#52
Exceptional
$112,796
Afghans
99.8
/100
|
#53
Exceptional
$112,676
Greeks
99.8
/100
|
#54
Exceptional
$112,630
Lithuanians
99.8
/100
|
#55
Exceptional
$112,484
Egyptians
99.7
/100
|
#56
Exceptional
$112,256
Immigrants | Scotland
99.7
/100
|
#57
Exceptional
$112,175
Soviet Union
99.7
/100
|
#58
Exceptional
$112,008
Immigrants | Europe
99.7
/100
|
#59
Exceptional
$111,984
Immigrants | Netherlands
99.7
/100
|
#60
Exceptional
$111,982
Immigrants | Czechoslovakia
99.7
/100
|
#61
Exceptional
$111,914
Immigrants | Norway
99.7
/100
|
#62
Exceptional
$111,669
Mongolians
99.6
/100
|
#63
Exceptional
$111,602
Immigrants | Latvia
99.6
/100
|
#64
Exceptional
$111,454
Immigrants | Belarus
99.6
/100
|
#65
Exceptional
$111,430
New Zealanders
99.6
/100
|
#66
Exceptional
$111,286

Demographics Similar to French by Householder Income Ages 45 - 64 years

In terms of householder income ages 45 - 64 years, the demographic groups most similar to French are Colombian ($99,772, a difference of 0.050%), Spaniard ($99,889, a difference of 0.070%), Finnish ($99,904, a difference of 0.080%), Immigrants ($99,943, a difference of 0.12%), and Dutch ($99,650, a difference of 0.17%).
DemographicsRating | RankHouseholder Income Ages 45 - 64 years
Moroccans
47.7
/100
|
#177
Average
$100,138
Immigrants | Cameroon
47.0
/100
|
#178
Average
$100,084
Belgians
46.7
/100
|
#179
Average
$100,060
Aleuts
46.6
/100
|
#180
Average
$100,052
Immigrants | Immigrants
45.3
/100
|
#181
Average
$99,943
Finns
44.8
/100
|
#182
Average
$99,904
Spaniards
44.6
/100
|
#183
Average
$99,889
French
43.8
/100
|
#184
Average
$99,824
Colombians
43.2
/100
|
#185
Average
$99,772
Dutch
41.7
/100
|
#186
Average
$99,650
Iraqis
38.5
/100
|
#187
Fair
$99,387
Immigrants | Portugal
36.3
/100
|
#188
Fair
$99,203
Immigrants | South America
35.4
/100
|
#189
Fair
$99,126
French Canadians
35.1
/100
|
#190
Fair
$99,093
Kenyans
33.7
/100
|
#191
Fair
$98,970