Immigrants from England vs Immigrants from India Median Earnings

COMPARE

Immigrants from England
Race
Ancestry
AfghanAfricanAlaska NativeAlaskan AthabascanAlbanianAleutAlsatianAmericanApacheArabArapahoArgentineanArmenianAssyrian/Chaldean/SyriacAustralianAustrianBahamianBangladeshiBarbadianBasqueBelgianBelizeanBermudanBhutaneseBlackfeetBolivianBrazilianBritishBritish West IndianBulgarianBurmeseCajunCambodianCanadianCape VerdeanCarpatho RusynCelticCentral AmericanCentral American IndianCherokeeCheyenneChickasawChileanChineseChippewaChoctawColombianColvilleComancheCosta RicanCreeCreekCroatianCrowCubanCypriotCzechCzechoslovakianDanishDelawareDominicanDutchDutch West IndianEastern EuropeanEcuadorianEgyptianEnglishEstonianEthiopianEuropeanFijianFilipinoFinnishFrenchFrench American IndianFrench CanadianGermanGerman RussianGhanaianGreekGuamanian/ChamorroGuatemalanGuyaneseHaitianHmongHonduranHopiHoumaHungarianIcelanderIndian (Asian)IndonesianInupiatIranianIraqiIrishIroquoisIsraeliItalianJamaicanJapaneseJordanianKenyanKiowaKoreanLaotianLatvianLebaneseLiberianLithuanianLumbeeLuxembourgerMacedonianMalaysianMalteseMarshalleseMenomineeMexicanMexican American IndianMongolianMoroccanNative HawaiianNavajoNepaleseNew ZealanderNicaraguanNigerianNorthern EuropeanNorwegianOkinawanOsageOttawaPaiutePakistaniPalestinianPanamanianParaguayanPennsylvania GermanPeruvianPimaPolishPortuguesePotawatomiPuebloPuerto RicanPuget Sound SalishRomanianRussianSalvadoranSamoanScandinavianScotch-IrishScottishSeminoleSenegaleseSerbianShoshoneSierra LeoneanSiouxSlavicSlovakSloveneSomaliSouth AfricanSouth AmericanSouth American IndianSoviet UnionSpaniardSpanishSpanish AmericanSpanish American IndianSri LankanSubsaharan AfricanSudaneseSwedishSwissSyrianTaiwaneseThaiTlingit-HaidaTohono O'OdhamTonganTrinidadian and TobagonianTsimshianTurkishU.S. Virgin IslanderUgandanUkrainianUruguayanUteVenezuelanVietnameseWelshWest IndianYakamaYaquiYugoslavianYumanYup'ikZimbabwean
Immigration
NonimmigrantsImmigrantsAfghanistanAfricaAlbaniaArgentinaArmeniaAsiaAustraliaAustriaBahamasBangladeshBarbadosBelarusBelgiumBelizeBoliviaBosnia and HerzegovinaBrazilBulgariaBurma/MyanmarCabo VerdeCambodiaCameroonCanadaCaribbeanCentral AmericaChileChinaColombiaCongoCosta RicaCroatiaCubaCzechoslovakiaDenmarkDominicaDominican RepublicEastern AfricaEastern AsiaEastern EuropeEcuadorEgyptEl SalvadorEnglandEritreaEthiopiaEuropeFijiFranceGermanyGhanaGreeceGrenadaGuatemalaGuyanaHaitiHondurasHong KongHungaryIndonesiaIranIraqIrelandIsraelItalyJamaicaJapanJordanKazakhstanKenyaKoreaKuwaitLaosLatin AmericaLatviaLebanonLiberiaLithuaniaMalaysiaMexicoMicronesiaMiddle AfricaMoldovaMoroccoNepalNetherlandsNicaraguaNigeriaNorth AmericaNorth MacedoniaNorthern AfricaNorthern EuropeNorwayOceaniaPakistanPanamaPeruPhilippinesPolandPortugalRomaniaRussiaSaudi ArabiaScotlandSenegalSerbiaSierra LeoneSingaporeSomaliaSouth AfricaSouth AmericaSouth Central AsiaSouth Eastern AsiaSouthern EuropeSpainSri LankaSt. Vincent and the GrenadinesSudanSwedenSwitzerlandSyriaTaiwanThailandTrinidad and TobagoTurkeyUgandaUkraineUruguayUzbekistanVenezuelaVietnamWest IndiesWestern AfricaWestern AsiaWestern EuropeYemenZaireZimbabweAzores
Immigrants from India
Race
Ancestry
AfghanAfricanAlaska NativeAlaskan AthabascanAlbanianAleutAlsatianAmericanApacheArabArapahoArgentineanArmenianAssyrian/Chaldean/SyriacAustralianAustrianBahamianBangladeshiBarbadianBasqueBelgianBelizeanBermudanBhutaneseBlackfeetBolivianBrazilianBritishBritish West IndianBulgarianBurmeseCajunCambodianCanadianCape VerdeanCarpatho RusynCelticCentral AmericanCentral American IndianCherokeeCheyenneChickasawChileanChineseChippewaChoctawColombianColvilleComancheCosta RicanCreeCreekCroatianCrowCubanCypriotCzechCzechoslovakianDanishDelawareDominicanDutchDutch West IndianEastern EuropeanEcuadorianEgyptianEnglishEstonianEthiopianEuropeanFijianFilipinoFinnishFrenchFrench American IndianFrench CanadianGermanGerman RussianGhanaianGreekGuamanian/ChamorroGuatemalanGuyaneseHaitianHmongHonduranHopiHoumaHungarianIcelanderIndian (Asian)IndonesianInupiatIranianIraqiIrishIroquoisIsraeliItalianJamaicanJapaneseJordanianKenyanKiowaKoreanLaotianLatvianLebaneseLiberianLithuanianLumbeeLuxembourgerMacedonianMalaysianMalteseMarshalleseMenomineeMexicanMexican American IndianMongolianMoroccanNative HawaiianNavajoNepaleseNew ZealanderNicaraguanNigerianNorthern EuropeanNorwegianOkinawanOsageOttawaPaiutePakistaniPalestinianPanamanianParaguayanPennsylvania GermanPeruvianPimaPolishPortuguesePotawatomiPuebloPuerto RicanPuget Sound SalishRomanianRussianSalvadoranSamoanScandinavianScotch-IrishScottishSeminoleSenegaleseSerbianShoshoneSierra LeoneanSiouxSlavicSlovakSloveneSomaliSouth AfricanSouth AmericanSouth American IndianSoviet UnionSpaniardSpanishSpanish AmericanSpanish American IndianSri LankanSubsaharan AfricanSudaneseSwedishSwissSyrianTaiwaneseThaiTlingit-HaidaTohono O'OdhamTonganTrinidadian and TobagonianTsimshianTurkishU.S. Virgin IslanderUgandanUkrainianUruguayanUteVenezuelanVietnameseWelshWest IndianYakamaYaquiYugoslavianYumanYup'ikZimbabwean
Immigration
NonimmigrantsImmigrantsAfghanistanAfricaAlbaniaArgentinaArmeniaAsiaAustraliaAustriaBahamasBangladeshBarbadosBelarusBelgiumBelizeBoliviaBosnia and HerzegovinaBrazilBulgariaBurma/MyanmarCabo VerdeCambodiaCameroonCanadaCaribbeanCentral AmericaChileChinaColombiaCongoCosta RicaCroatiaCubaCzechoslovakiaDenmarkDominicaDominican RepublicEastern AfricaEastern AsiaEastern EuropeEcuadorEgyptEl SalvadorEritreaEthiopiaEuropeFijiFranceGermanyGhanaGreeceGrenadaGuatemalaGuyanaHaitiHondurasHong KongHungaryIndiaIndonesiaIranIraqIrelandIsraelItalyJamaicaJapanJordanKazakhstanKenyaKoreaKuwaitLaosLatin AmericaLatviaLebanonLiberiaLithuaniaMalaysiaMexicoMicronesiaMiddle AfricaMoldovaMoroccoNepalNetherlandsNicaraguaNigeriaNorth AmericaNorth MacedoniaNorthern AfricaNorthern EuropeNorwayOceaniaPakistanPanamaPeruPhilippinesPolandPortugalRomaniaRussiaSaudi ArabiaScotlandSenegalSerbiaSierra LeoneSingaporeSomaliaSouth AfricaSouth AmericaSouth Central AsiaSouth Eastern AsiaSouthern EuropeSpainSri LankaSt. Vincent and the GrenadinesSudanSwedenSwitzerlandSyriaTaiwanThailandTrinidad and TobagoTurkeyUgandaUkraineUruguayUzbekistanVenezuelaVietnamWest IndiesWestern AfricaWestern AsiaWestern EuropeYemenZaireZimbabweAzores
Median Earnings
Income
Poverty
Unemployment
Labor Participation
Family Structure
Vehicle Availability
Education Level
Disability

Median Earnings Comparison

Immigrants from England

Immigrants from India

Exceptional
Exceptional
$49,722
MEDIAN EARNINGS
99.0/ 100
METRIC RATING
95th/ 347
METRIC RANK
$60,648
MEDIAN EARNINGS
100.0/ 100
METRIC RATING
3rd/ 347
METRIC RANK

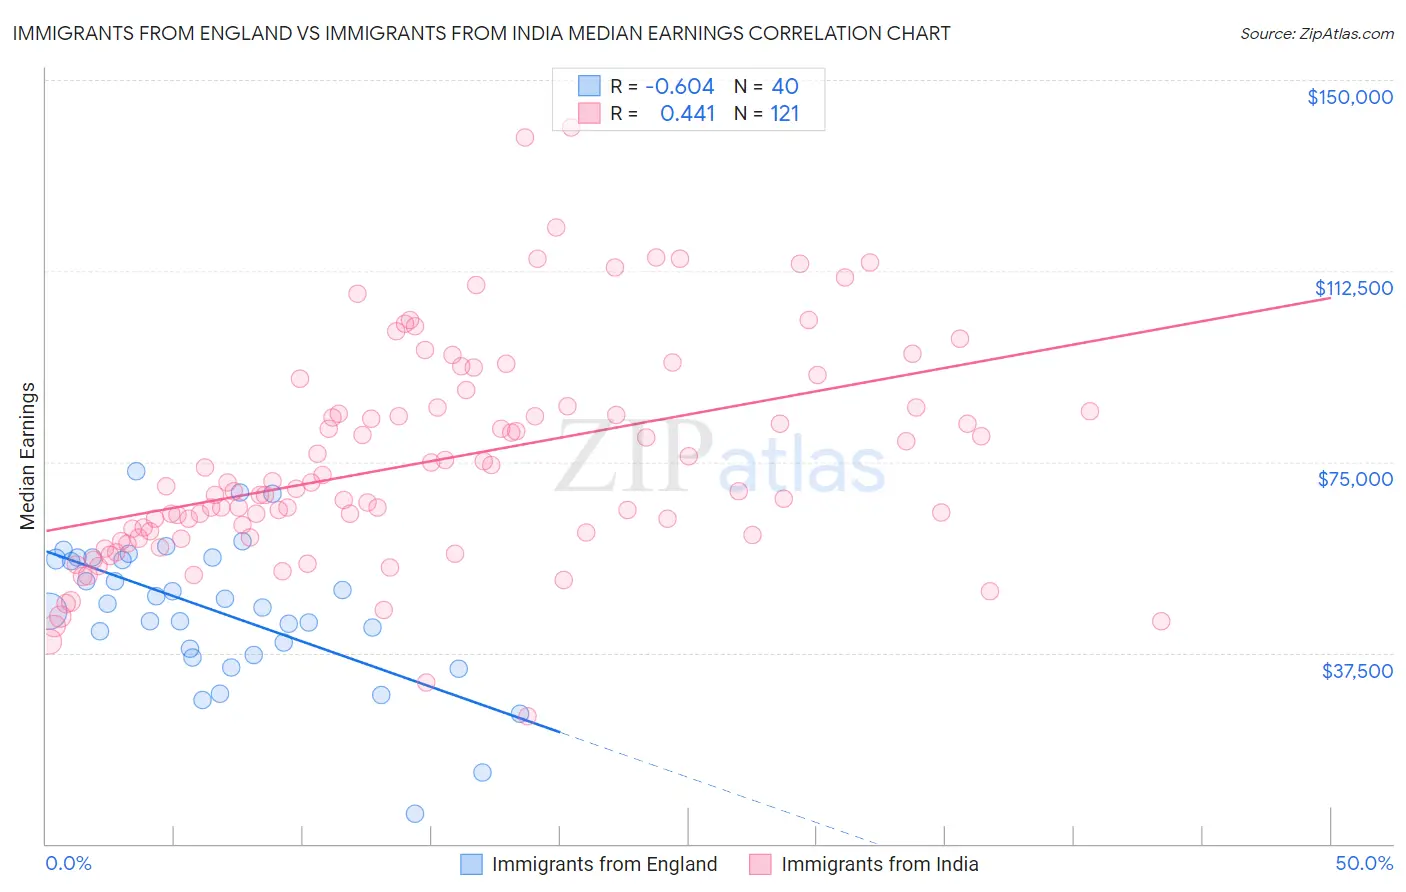
Immigrants from England vs Immigrants from India Median Earnings Correlation Chart

The statistical analysis conducted on geographies consisting of 391,848,083 people shows a significant negative correlation between the proportion of Immigrants from England and median earnings in the United States with a correlation coefficient (R) of -0.604 and weighted average of $49,722. Similarly, the statistical analysis conducted on geographies consisting of 434,105,381 people shows a moderate positive correlation between the proportion of Immigrants from India and median earnings in the United States with a correlation coefficient (R) of 0.441 and weighted average of $60,648, a difference of 22.0%.
Immigrants from England vs Immigrants from India Median Earnings

Median Earnings Correlation Summary

MeasurementImmigrants from EnglandImmigrants from India
Minimum$5,997$24,957
Maximum$73,280$140,742
Range$67,283$115,785
Mean$45,709$74,941
Median$46,726$69,769
Interquartile 25% (IQ1)$37,678$60,363
Interquartile 75% (IQ3)$55,979$85,753
Interquartile Range (IQR)$18,301$25,390
Standard Deviation (Sample)$13,949$21,309
Standard Deviation (Population)$13,773$21,220

Similar Demographics by Median Earnings

Demographics Similar to Immigrants from England by Median Earnings

In terms of median earnings, the demographic groups most similar to Immigrants from England are Croatian ($49,724, a difference of 0.0%), Immigrants from Lebanon ($49,682, a difference of 0.080%), Immigrants from North Macedonia ($49,658, a difference of 0.13%), Immigrants from Northern Africa ($49,648, a difference of 0.15%), and Armenian ($49,804, a difference of 0.16%).
DemographicsRating | RankMedian Earnings
Albanians
99.4
/100
|
#88
Exceptional
$50,116
Immigrants | North America
99.4
/100
|
#89
Exceptional
$50,108
Italians
99.3
/100
|
#90
Exceptional
$49,915
Macedonians
99.2
/100
|
#91
Exceptional
$49,893
Immigrants | Argentina
99.2
/100
|
#92
Exceptional
$49,841
Armenians
99.1
/100
|
#93
Exceptional
$49,804
Croatians
99.0
/100
|
#94
Exceptional
$49,724
Immigrants | England
99.0
/100
|
#95
Exceptional
$49,722
Immigrants | Lebanon
99.0
/100
|
#96
Exceptional
$49,682
Immigrants | North Macedonia
98.9
/100
|
#97
Exceptional
$49,658
Immigrants | Northern Africa
98.9
/100
|
#98
Exceptional
$49,648
Immigrants | Afghanistan
98.9
/100
|
#99
Exceptional
$49,645
Immigrants | Poland
98.9
/100
|
#100
Exceptional
$49,633
Jordanians
98.9
/100
|
#101
Exceptional
$49,632
Ethiopians
98.8
/100
|
#102
Exceptional
$49,572

Demographics Similar to Immigrants from India by Median Earnings

In terms of median earnings, the demographic groups most similar to Immigrants from India are Immigrants from Taiwan ($61,151, a difference of 0.83%), Filipino ($61,197, a difference of 0.91%), Immigrants from Hong Kong ($59,433, a difference of 2.0%), Thai ($59,237, a difference of 2.4%), and Immigrants from Singapore ($59,038, a difference of 2.7%).
DemographicsRating | RankMedian Earnings
Filipinos
100.0
/100
|
#1
Exceptional
$61,197
Immigrants | Taiwan
100.0
/100
|
#2
Exceptional
$61,151
Immigrants | India
100.0
/100
|
#3
Exceptional
$60,648
Immigrants | Hong Kong
100.0
/100
|
#4
Exceptional
$59,433
Thais
100.0
/100
|
#5
Exceptional
$59,237
Immigrants | Singapore
100.0
/100
|
#6
Exceptional
$59,038
Iranians
100.0
/100
|
#7
Exceptional
$58,474
Immigrants | Iran
100.0
/100
|
#8
Exceptional
$57,612
Okinawans
100.0
/100
|
#9
Exceptional
$57,550
Immigrants | South Central Asia
100.0
/100
|
#10
Exceptional
$57,114
Immigrants | Israel
100.0
/100
|
#11
Exceptional
$57,034
Immigrants | Ireland
100.0
/100
|
#12
Exceptional
$56,854
Immigrants | China
100.0
/100
|
#13
Exceptional
$56,638
Immigrants | Australia
100.0
/100
|
#14
Exceptional
$56,305
Indians (Asian)
100.0
/100
|
#15
Exceptional
$56,253