Immigrants from El Salvador vs Spanish American Median Family Income
COMPARE
Immigrants from El Salvador
Spanish American
Median Family Income
Median Family Income Comparison
Immigrants from El Salvador
Spanish Americans
$92,545
MEDIAN FAMILY INCOME
0.6/ 100
METRIC RATING
252nd/ 347
METRIC RANK
$90,322
MEDIAN FAMILY INCOME
0.2/ 100
METRIC RATING
274th/ 347
METRIC RANK
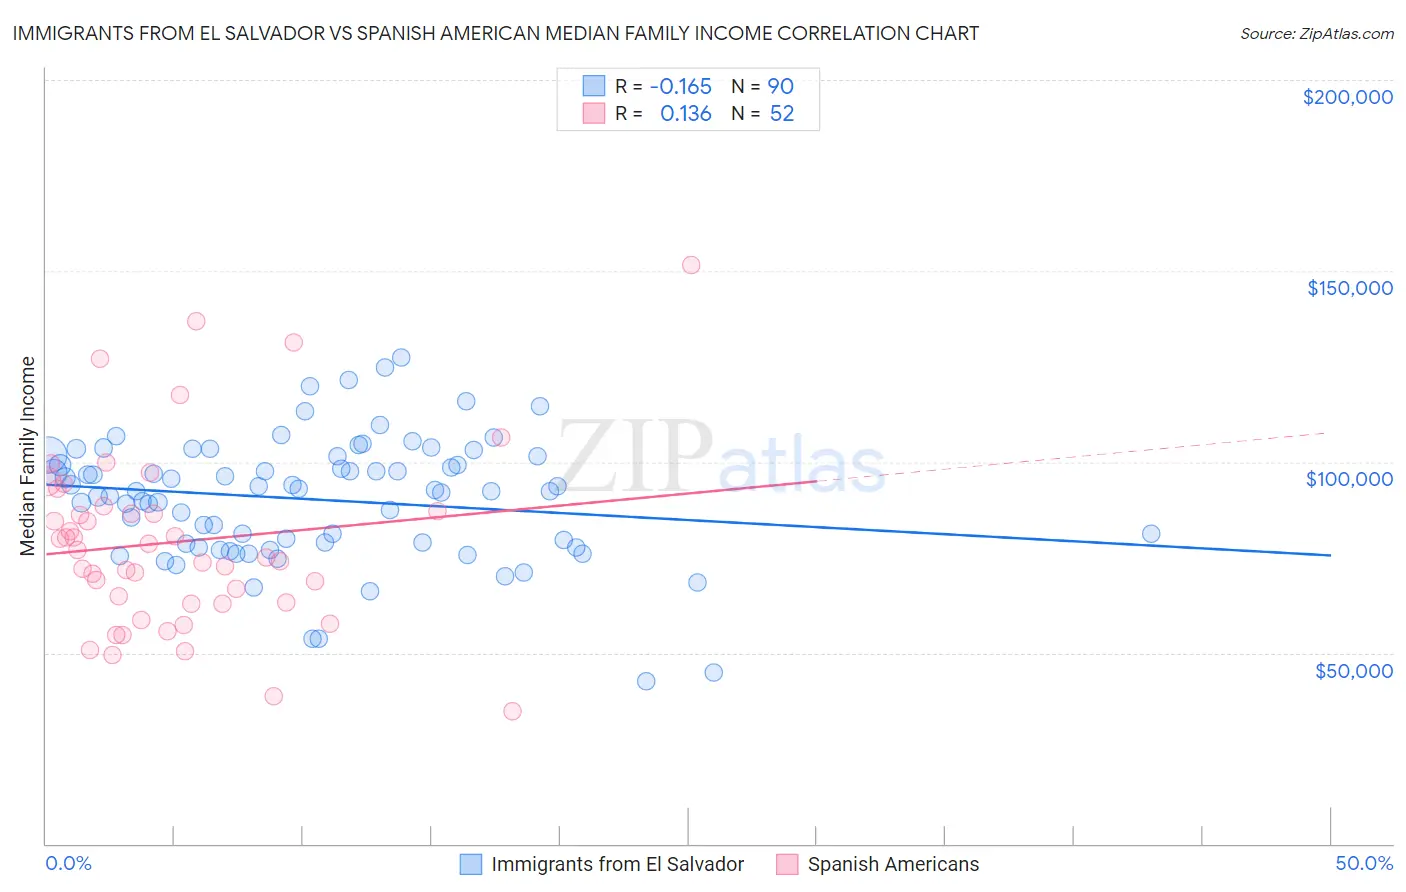
Immigrants from El Salvador vs Spanish American Median Family Income Correlation Chart
The statistical analysis conducted on geographies consisting of 357,645,519 people shows a poor negative correlation between the proportion of Immigrants from El Salvador and median family income in the United States with a correlation coefficient (R) of -0.165 and weighted average of $92,545. Similarly, the statistical analysis conducted on geographies consisting of 103,155,631 people shows a poor positive correlation between the proportion of Spanish Americans and median family income in the United States with a correlation coefficient (R) of 0.136 and weighted average of $90,322, a difference of 2.5%.
Median Family Income Correlation Summary
| Measurement | Immigrants from El Salvador | Spanish American |
| Minimum | $42,420 | $34,804 |
| Maximum | $127,446 | $151,435 |
| Range | $85,026 | $116,631 |
| Mean | $90,153 | $79,090 |
| Median | $92,338 | $75,945 |
| Interquartile 25% (IQ1) | $78,680 | $62,996 |
| Interquartile 75% (IQ3) | $101,462 | $87,771 |
| Interquartile Range (IQR) | $22,782 | $24,775 |
| Standard Deviation (Sample) | $16,234 | $23,819 |
| Standard Deviation (Population) | $16,143 | $23,588 |
Similar Demographics by Median Family Income
Demographics Similar to Immigrants from El Salvador by Median Family Income
In terms of median family income, the demographic groups most similar to Immigrants from El Salvador are Immigrants from Guyana ($92,513, a difference of 0.030%), Immigrants from Somalia ($92,609, a difference of 0.070%), Immigrants from Barbados ($92,419, a difference of 0.14%), West Indian ($92,765, a difference of 0.24%), and Immigrants from Ecuador ($92,837, a difference of 0.32%).
| Demographics | Rating | Rank | Median Family Income |
| Immigrants | Middle Africa | 1.0 /100 | #245 | Tragic $93,593 |
| Guyanese | 0.9 /100 | #246 | Tragic $93,373 |
| Immigrants | Senegal | 0.7 /100 | #247 | Tragic $92,912 |
| French American Indians | 0.7 /100 | #248 | Tragic $92,872 |
| Immigrants | Ecuador | 0.7 /100 | #249 | Tragic $92,837 |
| West Indians | 0.6 /100 | #250 | Tragic $92,765 |
| Immigrants | Somalia | 0.6 /100 | #251 | Tragic $92,609 |
| Immigrants | El Salvador | 0.6 /100 | #252 | Tragic $92,545 |
| Immigrants | Guyana | 0.6 /100 | #253 | Tragic $92,513 |
| Immigrants | Barbados | 0.5 /100 | #254 | Tragic $92,419 |
| Immigrants | Laos | 0.5 /100 | #255 | Tragic $92,239 |
| Nicaraguans | 0.5 /100 | #256 | Tragic $92,231 |
| Americans | 0.4 /100 | #257 | Tragic $92,096 |
| Osage | 0.4 /100 | #258 | Tragic $91,926 |
| Cape Verdeans | 0.4 /100 | #259 | Tragic $91,848 |
Demographics Similar to Spanish Americans by Median Family Income
In terms of median family income, the demographic groups most similar to Spanish Americans are Immigrants from Micronesia ($90,345, a difference of 0.020%), Immigrants from Liberia ($90,450, a difference of 0.14%), Iroquois ($90,543, a difference of 0.24%), Immigrants from St. Vincent and the Grenadines ($90,094, a difference of 0.25%), and Jamaican ($90,581, a difference of 0.29%).
| Demographics | Rating | Rank | Median Family Income |
| Mexican American Indians | 0.2 /100 | #267 | Tragic $90,918 |
| Cree | 0.2 /100 | #268 | Tragic $90,882 |
| Belizeans | 0.2 /100 | #269 | Tragic $90,880 |
| Jamaicans | 0.2 /100 | #270 | Tragic $90,581 |
| Iroquois | 0.2 /100 | #271 | Tragic $90,543 |
| Immigrants | Liberia | 0.2 /100 | #272 | Tragic $90,450 |
| Immigrants | Micronesia | 0.2 /100 | #273 | Tragic $90,345 |
| Spanish Americans | 0.2 /100 | #274 | Tragic $90,322 |
| Immigrants | St. Vincent and the Grenadines | 0.2 /100 | #275 | Tragic $90,094 |
| Immigrants | Zaire | 0.1 /100 | #276 | Tragic $89,285 |
| Immigrants | Jamaica | 0.1 /100 | #277 | Tragic $89,268 |
| Immigrants | Grenada | 0.1 /100 | #278 | Tragic $89,249 |
| Immigrants | Belize | 0.1 /100 | #279 | Tragic $89,197 |
| British West Indians | 0.1 /100 | #280 | Tragic $88,987 |
| Blackfeet | 0.1 /100 | #281 | Tragic $88,717 |