Immigrants from Ecuador vs Immigrants from Uruguay Median Male Earnings
COMPARE
Immigrants from Ecuador
Immigrants from Uruguay
Median Male Earnings
Median Male Earnings Comparison
Immigrants from Ecuador
Immigrants from Uruguay
$50,474
MEDIAN MALE EARNINGS
1.9/ 100
METRIC RATING
246th/ 347
METRIC RANK
$52,860
MEDIAN MALE EARNINGS
16.8/ 100
METRIC RATING
202nd/ 347
METRIC RANK
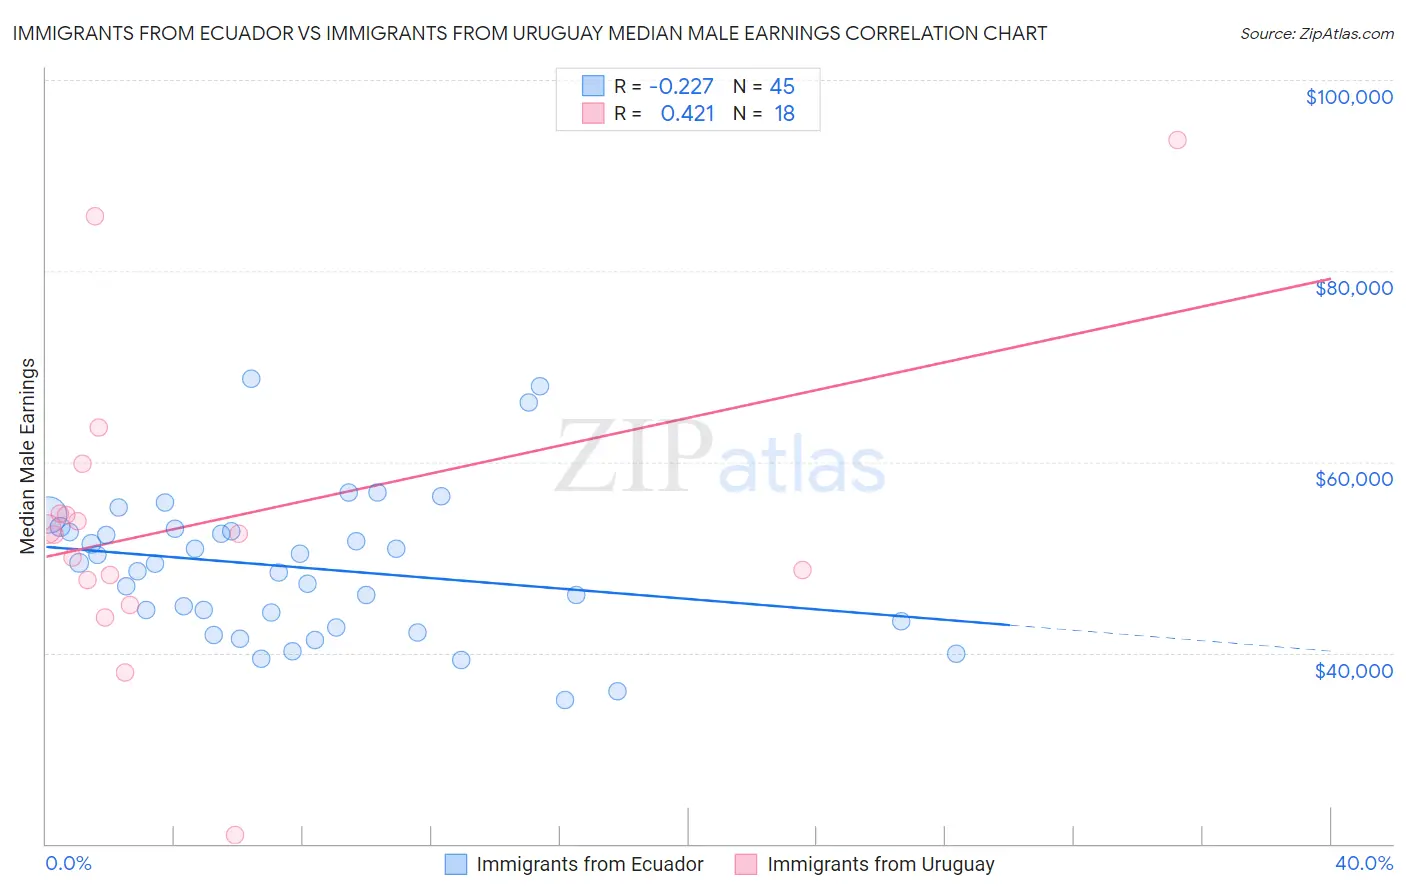
Immigrants from Ecuador vs Immigrants from Uruguay Median Male Earnings Correlation Chart
The statistical analysis conducted on geographies consisting of 270,963,841 people shows a weak negative correlation between the proportion of Immigrants from Ecuador and median male earnings in the United States with a correlation coefficient (R) of -0.227 and weighted average of $50,474. Similarly, the statistical analysis conducted on geographies consisting of 133,249,563 people shows a moderate positive correlation between the proportion of Immigrants from Uruguay and median male earnings in the United States with a correlation coefficient (R) of 0.421 and weighted average of $52,860, a difference of 4.7%.
Median Male Earnings Correlation Summary
| Measurement | Immigrants from Ecuador | Immigrants from Uruguay |
| Minimum | $35,014 | $20,946 |
| Maximum | $68,684 | $93,710 |
| Range | $33,670 | $72,764 |
| Mean | $48,933 | $53,632 |
| Median | $49,320 | $52,453 |
| Interquartile 25% (IQ1) | $42,981 | $47,598 |
| Interquartile 75% (IQ3) | $52,866 | $54,536 |
| Interquartile Range (IQR) | $9,884 | $6,938 |
| Standard Deviation (Sample) | $7,606 | $16,044 |
| Standard Deviation (Population) | $7,521 | $15,592 |
Similar Demographics by Median Male Earnings
Demographics Similar to Immigrants from Ecuador by Median Male Earnings
In terms of median male earnings, the demographic groups most similar to Immigrants from Ecuador are Hawaiian ($50,488, a difference of 0.030%), Subsaharan African ($50,408, a difference of 0.13%), Houma ($50,547, a difference of 0.14%), Guyanese ($50,613, a difference of 0.27%), and French American Indian ($50,611, a difference of 0.27%).
| Demographics | Rating | Rank | Median Male Earnings |
| Americans | 2.5 /100 | #239 | Tragic $50,761 |
| West Indians | 2.3 /100 | #240 | Tragic $50,682 |
| Immigrants | St. Vincent and the Grenadines | 2.3 /100 | #241 | Tragic $50,665 |
| Guyanese | 2.2 /100 | #242 | Tragic $50,613 |
| French American Indians | 2.2 /100 | #243 | Tragic $50,611 |
| Houma | 2.0 /100 | #244 | Tragic $50,547 |
| Hawaiians | 1.9 /100 | #245 | Tragic $50,488 |
| Immigrants | Ecuador | 1.9 /100 | #246 | Tragic $50,474 |
| Sub-Saharan Africans | 1.8 /100 | #247 | Tragic $50,408 |
| Immigrants | Guyana | 1.6 /100 | #248 | Tragic $50,321 |
| Immigrants | Burma/Myanmar | 1.6 /100 | #249 | Tragic $50,298 |
| Osage | 1.6 /100 | #250 | Tragic $50,292 |
| Immigrants | Grenada | 1.6 /100 | #251 | Tragic $50,279 |
| Immigrants | Cabo Verde | 1.2 /100 | #252 | Tragic $50,009 |
| German Russians | 1.1 /100 | #253 | Tragic $49,924 |
Demographics Similar to Immigrants from Uruguay by Median Male Earnings
In terms of median male earnings, the demographic groups most similar to Immigrants from Uruguay are Immigrants from Bosnia and Herzegovina ($52,869, a difference of 0.020%), Panamanian ($52,835, a difference of 0.050%), Immigrants from Thailand ($52,908, a difference of 0.090%), Ghanaian ($52,810, a difference of 0.10%), and Immigrants from Colombia ($52,725, a difference of 0.26%).
| Demographics | Rating | Rank | Median Male Earnings |
| Immigrants | Azores | 27.5 /100 | #195 | Fair $53,503 |
| Immigrants | Africa | 26.6 /100 | #196 | Fair $53,457 |
| Immigrants | Kenya | 26.0 /100 | #197 | Fair $53,427 |
| Immigrants | Costa Rica | 22.6 /100 | #198 | Fair $53,237 |
| Tongans | 22.3 /100 | #199 | Fair $53,218 |
| Immigrants | Thailand | 17.5 /100 | #200 | Poor $52,908 |
| Immigrants | Bosnia and Herzegovina | 16.9 /100 | #201 | Poor $52,869 |
| Immigrants | Uruguay | 16.8 /100 | #202 | Poor $52,860 |
| Panamanians | 16.5 /100 | #203 | Poor $52,835 |
| Ghanaians | 16.1 /100 | #204 | Poor $52,810 |
| Immigrants | Colombia | 15.0 /100 | #205 | Poor $52,725 |
| Immigrants | Iraq | 14.5 /100 | #206 | Poor $52,681 |
| Vietnamese | 12.7 /100 | #207 | Poor $52,525 |
| Venezuelans | 12.5 /100 | #208 | Poor $52,510 |
| Bermudans | 12.1 /100 | #209 | Poor $52,465 |