Immigrants from Eastern Europe vs Moroccan Median Earnings
COMPARE
Immigrants from Eastern Europe
Moroccan
Median Earnings
Median Earnings Comparison
Immigrants from Eastern Europe
Moroccans
$51,624
MEDIAN EARNINGS
99.9/ 100
METRIC RATING
57th/ 347
METRIC RANK
$48,838
MEDIAN EARNINGS
96.7/ 100
METRIC RATING
114th/ 347
METRIC RANK
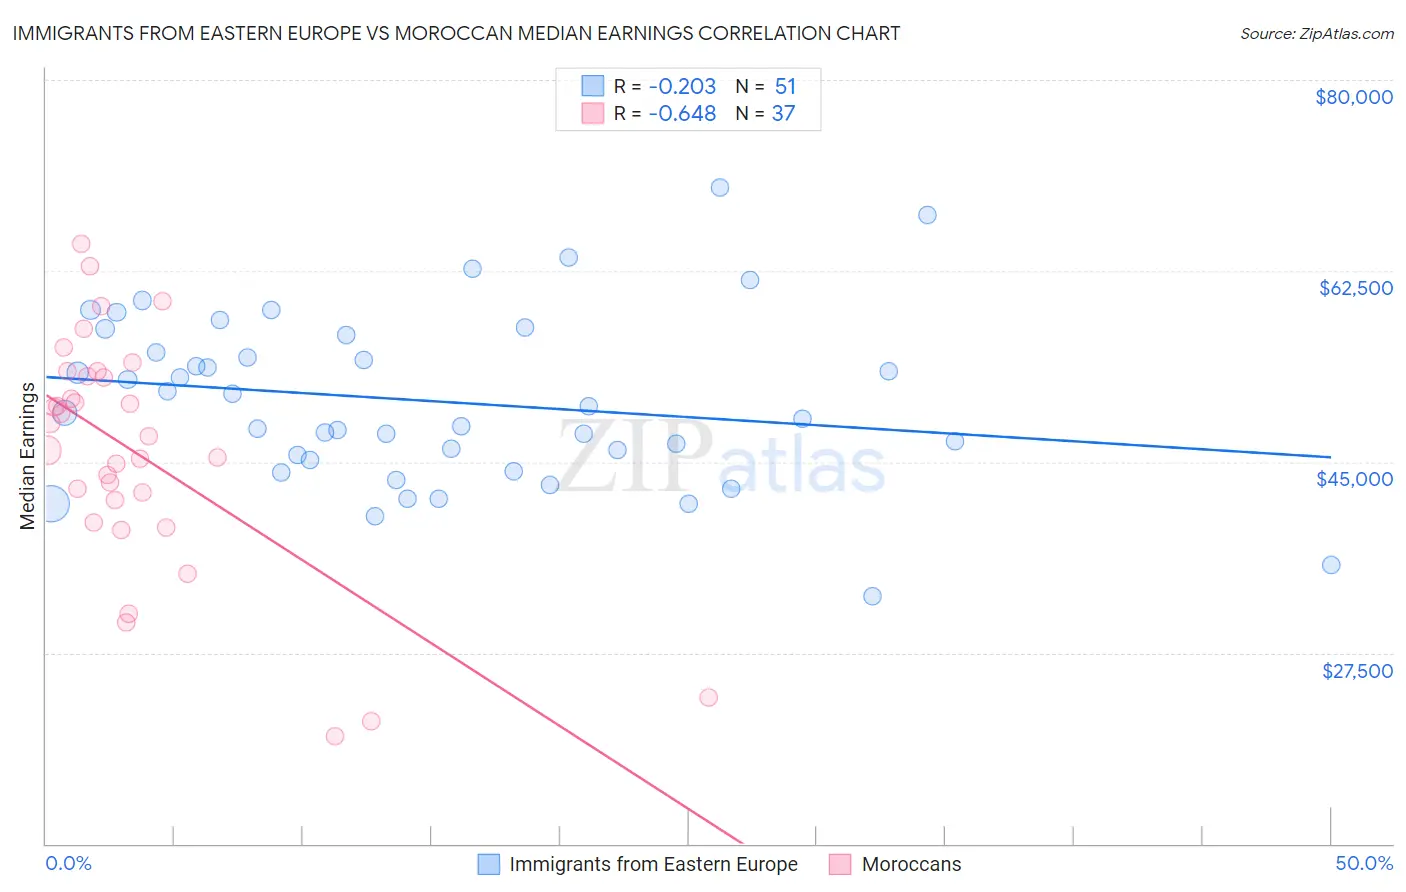
Immigrants from Eastern Europe vs Moroccan Median Earnings Correlation Chart
The statistical analysis conducted on geographies consisting of 475,833,062 people shows a weak negative correlation between the proportion of Immigrants from Eastern Europe and median earnings in the United States with a correlation coefficient (R) of -0.203 and weighted average of $51,624. Similarly, the statistical analysis conducted on geographies consisting of 201,800,770 people shows a significant negative correlation between the proportion of Moroccans and median earnings in the United States with a correlation coefficient (R) of -0.648 and weighted average of $48,838, a difference of 5.7%.
Median Earnings Correlation Summary
| Measurement | Immigrants from Eastern Europe | Moroccan |
| Minimum | $32,703 | $19,886 |
| Maximum | $70,148 | $64,979 |
| Range | $37,445 | $45,093 |
| Mean | $50,592 | $45,820 |
| Median | $49,479 | $47,333 |
| Interquartile 25% (IQ1) | $45,140 | $40,473 |
| Interquartile 75% (IQ3) | $56,614 | $53,052 |
| Interquartile Range (IQR) | $11,474 | $12,578 |
| Standard Deviation (Sample) | $7,882 | $10,819 |
| Standard Deviation (Population) | $7,805 | $10,672 |
Similar Demographics by Median Earnings
Demographics Similar to Immigrants from Eastern Europe by Median Earnings
In terms of median earnings, the demographic groups most similar to Immigrants from Eastern Europe are Immigrants from Bolivia ($51,605, a difference of 0.040%), Immigrants from Croatia ($51,581, a difference of 0.080%), Immigrants from Pakistan ($51,693, a difference of 0.13%), Immigrants from Serbia ($51,557, a difference of 0.13%), and Immigrants from Latvia ($51,555, a difference of 0.13%).
| Demographics | Rating | Rank | Median Earnings |
| Immigrants | South Africa | 100.0 /100 | #50 | Exceptional $51,850 |
| Immigrants | Austria | 99.9 /100 | #51 | Exceptional $51,826 |
| Estonians | 99.9 /100 | #52 | Exceptional $51,772 |
| Immigrants | Norway | 99.9 /100 | #53 | Exceptional $51,758 |
| Immigrants | Indonesia | 99.9 /100 | #54 | Exceptional $51,715 |
| Egyptians | 99.9 /100 | #55 | Exceptional $51,701 |
| Immigrants | Pakistan | 99.9 /100 | #56 | Exceptional $51,693 |
| Immigrants | Eastern Europe | 99.9 /100 | #57 | Exceptional $51,624 |
| Immigrants | Bolivia | 99.9 /100 | #58 | Exceptional $51,605 |
| Immigrants | Croatia | 99.9 /100 | #59 | Exceptional $51,581 |
| Immigrants | Serbia | 99.9 /100 | #60 | Exceptional $51,557 |
| Immigrants | Latvia | 99.9 /100 | #61 | Exceptional $51,555 |
| Immigrants | Romania | 99.9 /100 | #62 | Exceptional $51,337 |
| Immigrants | Bulgaria | 99.9 /100 | #63 | Exceptional $51,318 |
| New Zealanders | 99.9 /100 | #64 | Exceptional $51,246 |
Demographics Similar to Moroccans by Median Earnings
In terms of median earnings, the demographic groups most similar to Moroccans are Chinese ($48,836, a difference of 0.010%), Immigrants from Kuwait ($48,861, a difference of 0.050%), Northern European ($48,887, a difference of 0.10%), Immigrants from Zimbabwe ($48,913, a difference of 0.15%), and Immigrants from Ethiopia ($48,924, a difference of 0.17%).
| Demographics | Rating | Rank | Median Earnings |
| Immigrants | Morocco | 98.4 /100 | #107 | Exceptional $49,368 |
| Palestinians | 98.0 /100 | #108 | Exceptional $49,209 |
| Syrians | 97.1 /100 | #109 | Exceptional $48,934 |
| Immigrants | Ethiopia | 97.1 /100 | #110 | Exceptional $48,924 |
| Immigrants | Zimbabwe | 97.0 /100 | #111 | Exceptional $48,913 |
| Northern Europeans | 96.9 /100 | #112 | Exceptional $48,887 |
| Immigrants | Kuwait | 96.8 /100 | #113 | Exceptional $48,861 |
| Moroccans | 96.7 /100 | #114 | Exceptional $48,838 |
| Chinese | 96.7 /100 | #115 | Exceptional $48,836 |
| Koreans | 96.2 /100 | #116 | Exceptional $48,727 |
| Serbians | 95.9 /100 | #117 | Exceptional $48,677 |
| Immigrants | Jordan | 95.9 /100 | #118 | Exceptional $48,673 |
| Poles | 95.8 /100 | #119 | Exceptional $48,659 |
| Carpatho Rusyns | 95.5 /100 | #120 | Exceptional $48,617 |
| Arabs | 95.4 /100 | #121 | Exceptional $48,599 |