Immigrants from Eastern Africa vs Immigrants from Sudan Householder Income Ages 45 - 64 years

COMPARE

Immigrants from Eastern Africa
Race
Ancestry
AfghanAfricanAlaska NativeAlaskan AthabascanAlbanianAleutAlsatianAmericanApacheArabArapahoArgentineanArmenianAssyrian/Chaldean/SyriacAustralianAustrianBahamianBangladeshiBarbadianBasqueBelgianBelizeanBermudanBhutaneseBlackfeetBolivianBrazilianBritishBritish West IndianBulgarianBurmeseCajunCambodianCanadianCape VerdeanCarpatho RusynCelticCentral AmericanCentral American IndianCherokeeCheyenneChickasawChileanChineseChippewaChoctawColombianColvilleComancheCosta RicanCreeCreekCroatianCrowCubanCypriotCzechCzechoslovakianDanishDelawareDominicanDutchDutch West IndianEastern EuropeanEcuadorianEgyptianEnglishEstonianEthiopianEuropeanFijianFilipinoFinnishFrenchFrench American IndianFrench CanadianGermanGerman RussianGhanaianGreekGuamanian/ChamorroGuatemalanGuyaneseHaitianHmongHonduranHopiHoumaHungarianIcelanderIndian (Asian)IndonesianInupiatIranianIraqiIrishIroquoisIsraeliItalianJamaicanJapaneseJordanianKenyanKiowaKoreanLaotianLatvianLebaneseLiberianLithuanianLumbeeLuxembourgerMacedonianMalaysianMalteseMarshalleseMenomineeMexicanMexican American IndianMongolianMoroccanNative HawaiianNavajoNepaleseNew ZealanderNicaraguanNigerianNorthern EuropeanNorwegianOkinawanOsageOttawaPaiutePakistaniPalestinianPanamanianParaguayanPennsylvania GermanPeruvianPimaPolishPortuguesePotawatomiPuebloPuerto RicanPuget Sound SalishRomanianRussianSalvadoranSamoanScandinavianScotch-IrishScottishSeminoleSenegaleseSerbianShoshoneSierra LeoneanSiouxSlavicSlovakSloveneSomaliSouth AfricanSouth AmericanSouth American IndianSoviet UnionSpaniardSpanishSpanish AmericanSpanish American IndianSri LankanSubsaharan AfricanSudaneseSwedishSwissSyrianTaiwaneseThaiTlingit-HaidaTohono O'OdhamTonganTrinidadian and TobagonianTsimshianTurkishU.S. Virgin IslanderUgandanUkrainianUruguayanUteVenezuelanVietnameseWelshWest IndianYakamaYaquiYugoslavianYumanYup'ikZimbabwean
Immigration
NonimmigrantsImmigrantsAfghanistanAfricaAlbaniaArgentinaArmeniaAsiaAustraliaAustriaBahamasBangladeshBarbadosBelarusBelgiumBelizeBoliviaBosnia and HerzegovinaBrazilBulgariaBurma/MyanmarCabo VerdeCambodiaCameroonCanadaCaribbeanCentral AmericaChileChinaColombiaCongoCosta RicaCroatiaCubaCzechoslovakiaDenmarkDominicaDominican RepublicEastern AfricaEastern AsiaEastern EuropeEcuadorEgyptEl SalvadorEnglandEritreaEthiopiaEuropeFijiFranceGermanyGhanaGreeceGrenadaGuatemalaGuyanaHaitiHondurasHong KongHungaryIndiaIndonesiaIranIraqIrelandIsraelItalyJamaicaJapanJordanKazakhstanKenyaKoreaKuwaitLaosLatin AmericaLatviaLebanonLiberiaLithuaniaMalaysiaMexicoMicronesiaMiddle AfricaMoldovaMoroccoNepalNetherlandsNicaraguaNigeriaNorth AmericaNorth MacedoniaNorthern AfricaNorthern EuropeNorwayOceaniaPakistanPanamaPeruPhilippinesPolandPortugalRomaniaRussiaSaudi ArabiaScotlandSenegalSerbiaSierra LeoneSingaporeSomaliaSouth AfricaSouth AmericaSouth Central AsiaSouth Eastern AsiaSouthern EuropeSpainSri LankaSt. Vincent and the GrenadinesSwedenSwitzerlandSyriaTaiwanThailandTrinidad and TobagoTurkeyUgandaUkraineUruguayUzbekistanVenezuelaVietnamWest IndiesWestern AfricaWestern AsiaWestern EuropeYemenZaireZimbabweAzores
Immigrants from Sudan
Race
Ancestry
AfghanAfricanAlaska NativeAlaskan AthabascanAlbanianAleutAlsatianAmericanApacheArabArapahoArgentineanArmenianAssyrian/Chaldean/SyriacAustralianAustrianBahamianBangladeshiBarbadianBasqueBelgianBelizeanBermudanBhutaneseBlackfeetBolivianBrazilianBritishBritish West IndianBulgarianBurmeseCajunCambodianCanadianCape VerdeanCarpatho RusynCelticCentral AmericanCentral American IndianCherokeeCheyenneChickasawChileanChineseChippewaChoctawColombianColvilleComancheCosta RicanCreeCreekCroatianCrowCubanCypriotCzechCzechoslovakianDanishDelawareDominicanDutchDutch West IndianEastern EuropeanEcuadorianEgyptianEnglishEstonianEthiopianEuropeanFijianFilipinoFinnishFrenchFrench American IndianFrench CanadianGermanGerman RussianGhanaianGreekGuamanian/ChamorroGuatemalanGuyaneseHaitianHmongHonduranHopiHoumaHungarianIcelanderIndian (Asian)IndonesianInupiatIranianIraqiIrishIroquoisIsraeliItalianJamaicanJapaneseJordanianKenyanKiowaKoreanLaotianLatvianLebaneseLiberianLithuanianLumbeeLuxembourgerMacedonianMalaysianMalteseMarshalleseMenomineeMexicanMexican American IndianMongolianMoroccanNative HawaiianNavajoNepaleseNew ZealanderNicaraguanNigerianNorthern EuropeanNorwegianOkinawanOsageOttawaPaiutePakistaniPalestinianPanamanianParaguayanPennsylvania GermanPeruvianPimaPolishPortuguesePotawatomiPuebloPuerto RicanPuget Sound SalishRomanianRussianSalvadoranSamoanScandinavianScotch-IrishScottishSeminoleSenegaleseSerbianShoshoneSierra LeoneanSiouxSlavicSlovakSloveneSomaliSouth AfricanSouth AmericanSouth American IndianSoviet UnionSpaniardSpanishSpanish AmericanSpanish American IndianSri LankanSubsaharan AfricanSudaneseSwedishSwissSyrianTaiwaneseThaiTlingit-HaidaTohono O'OdhamTonganTrinidadian and TobagonianTsimshianTurkishU.S. Virgin IslanderUgandanUkrainianUruguayanUteVenezuelanVietnameseWelshWest IndianYakamaYaquiYugoslavianYumanYup'ikZimbabwean
Immigration
NonimmigrantsImmigrantsAfghanistanAfricaAlbaniaArgentinaArmeniaAsiaAustraliaAustriaBahamasBangladeshBarbadosBelarusBelgiumBelizeBoliviaBosnia and HerzegovinaBrazilBulgariaBurma/MyanmarCabo VerdeCambodiaCameroonCanadaCaribbeanCentral AmericaChileChinaColombiaCongoCosta RicaCroatiaCubaCzechoslovakiaDenmarkDominicaDominican RepublicEastern AsiaEastern EuropeEcuadorEgyptEl SalvadorEnglandEritreaEthiopiaEuropeFijiFranceGermanyGhanaGreeceGrenadaGuatemalaGuyanaHaitiHondurasHong KongHungaryIndiaIndonesiaIranIraqIrelandIsraelItalyJamaicaJapanJordanKazakhstanKenyaKoreaKuwaitLaosLatin AmericaLatviaLebanonLiberiaLithuaniaMalaysiaMexicoMicronesiaMiddle AfricaMoldovaMoroccoNepalNetherlandsNicaraguaNigeriaNorth AmericaNorth MacedoniaNorthern AfricaNorthern EuropeNorwayOceaniaPakistanPanamaPeruPhilippinesPolandPortugalRomaniaRussiaSaudi ArabiaScotlandSenegalSerbiaSierra LeoneSingaporeSomaliaSouth AfricaSouth AmericaSouth Central AsiaSouth Eastern AsiaSouthern EuropeSpainSri LankaSt. Vincent and the GrenadinesSudanSwedenSwitzerlandSyriaTaiwanThailandTrinidad and TobagoTurkeyUgandaUkraineUruguayUzbekistanVenezuelaVietnamWest IndiesWestern AfricaWestern AsiaWestern EuropeYemenZaireZimbabweAzores
Householder Income Ages 45 - 64 years
Income
Poverty
Unemployment
Labor Participation
Family Structure
Vehicle Availability
Education Level
Disability

Householder Income Ages 45 - 64 years Comparison

Immigrants from Eastern Africa

Immigrants from Sudan

Fair
Tragic
$98,467
HOUSEHOLDER INCOME AGES 45 - 64 YEARS
28.3/ 100
METRIC RATING
196th/ 347
METRIC RANK
$93,781
HOUSEHOLDER INCOME AGES 45 - 64 YEARS
3.6/ 100
METRIC RATING
230th/ 347
METRIC RANK

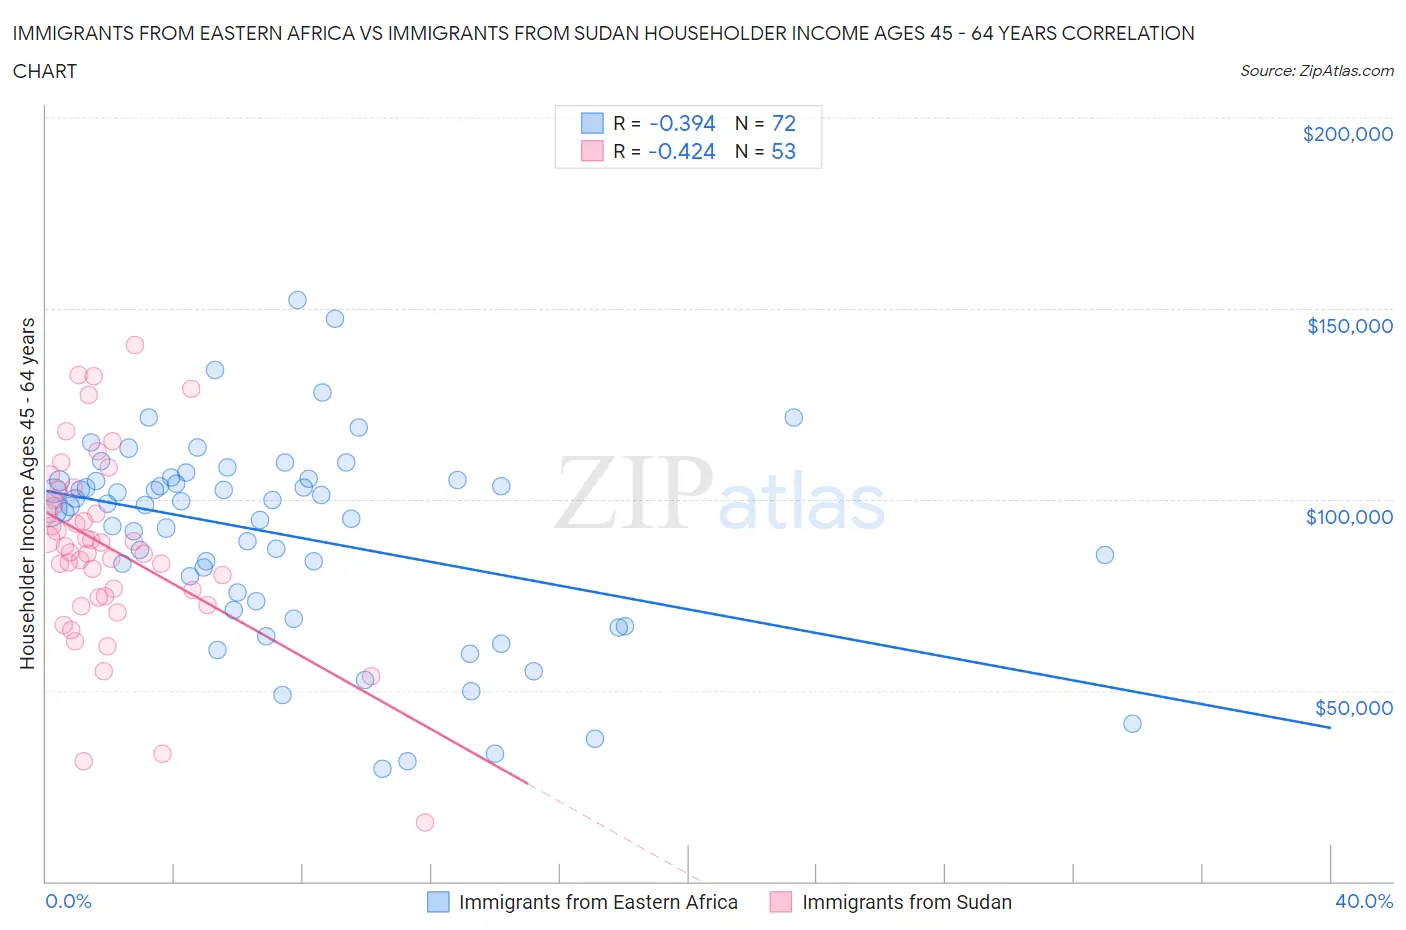
Immigrants from Eastern Africa vs Immigrants from Sudan Householder Income Ages 45 - 64 years Correlation Chart

The statistical analysis conducted on geographies consisting of 354,576,754 people shows a mild negative correlation between the proportion of Immigrants from Eastern Africa and household income with householder between the ages 45 and 64 in the United States with a correlation coefficient (R) of -0.394 and weighted average of $98,467. Similarly, the statistical analysis conducted on geographies consisting of 118,891,681 people shows a moderate negative correlation between the proportion of Immigrants from Sudan and household income with householder between the ages 45 and 64 in the United States with a correlation coefficient (R) of -0.424 and weighted average of $93,781, a difference of 5.0%.
Immigrants from Eastern Africa vs Immigrants from Sudan Householder Income Ages 45 - 64 years

Householder Income Ages 45 - 64 years Correlation Summary

MeasurementImmigrants from Eastern AfricaImmigrants from Sudan
Minimum$29,590$15,339
Maximum$152,098$140,439
Range$122,508$125,100
Mean$90,687$87,470
Median$98,438$87,864
Interquartile 25% (IQ1)$74,490$74,422
Interquartile 75% (IQ3)$104,938$101,249
Interquartile Range (IQR)$30,447$26,828
Standard Deviation (Sample)$25,936$24,768
Standard Deviation (Population)$25,755$24,533

Similar Demographics by Householder Income Ages 45 - 64 years

Demographics Similar to Immigrants from Eastern Africa by Householder Income Ages 45 - 64 years

In terms of householder income ages 45 - 64 years, the demographic groups most similar to Immigrants from Eastern Africa are Spanish ($98,554, a difference of 0.090%), Puget Sound Salish ($98,340, a difference of 0.13%), Uruguayan ($98,660, a difference of 0.20%), Immigrants from Iraq ($98,201, a difference of 0.27%), and Hawaiian ($98,778, a difference of 0.32%).
DemographicsRating | RankHouseholder Income Ages 45 - 64 years
Immigrants | South America
35.4
/100
|
#189
Fair
$99,126
French Canadians
35.1
/100
|
#190
Fair
$99,093
Kenyans
33.7
/100
|
#191
Fair
$98,970
Celtics
32.9
/100
|
#192
Fair
$98,896
Hawaiians
31.6
/100
|
#193
Fair
$98,778
Uruguayans
30.3
/100
|
#194
Fair
$98,660
Spanish
29.2
/100
|
#195
Fair
$98,554
Immigrants | Eastern Africa
28.3
/100
|
#196
Fair
$98,467
Puget Sound Salish
27.0
/100
|
#197
Fair
$98,340
Immigrants | Iraq
25.7
/100
|
#198
Fair
$98,201
Whites/Caucasians
24.6
/100
|
#199
Fair
$98,091
Immigrants | Kenya
23.5
/100
|
#200
Fair
$97,964
Yugoslavians
20.0
/100
|
#201
Fair
$97,558
Tlingit-Haida
18.9
/100
|
#202
Poor
$97,417
Immigrants | Thailand
18.8
/100
|
#203
Poor
$97,400

Demographics Similar to Immigrants from Sudan by Householder Income Ages 45 - 64 years

In terms of householder income ages 45 - 64 years, the demographic groups most similar to Immigrants from Sudan are Vietnamese ($93,788, a difference of 0.010%), Immigrants from Panama ($93,815, a difference of 0.040%), Ecuadorian ($93,739, a difference of 0.040%), Sudanese ($93,718, a difference of 0.070%), and Alaska Native ($93,991, a difference of 0.22%).
DemographicsRating | RankHouseholder Income Ages 45 - 64 years
Immigrants | Nonimmigrants
5.0
/100
|
#223
Tragic
$94,448
Immigrants | Bosnia and Herzegovina
4.6
/100
|
#224
Tragic
$94,288
Bermudans
4.4
/100
|
#225
Tragic
$94,197
Immigrants | Azores
4.3
/100
|
#226
Tragic
$94,138
Alaska Natives
4.0
/100
|
#227
Tragic
$93,991
Immigrants | Panama
3.7
/100
|
#228
Tragic
$93,815
Vietnamese
3.6
/100
|
#229
Tragic
$93,788
Immigrants | Sudan
3.6
/100
|
#230
Tragic
$93,781
Ecuadorians
3.6
/100
|
#231
Tragic
$93,739
Sudanese
3.5
/100
|
#232
Tragic
$93,718
Nepalese
3.0
/100
|
#233
Tragic
$93,355
Immigrants | El Salvador
2.7
/100
|
#234
Tragic
$93,176
Nicaraguans
2.0
/100
|
#235
Tragic
$92,554
Immigrants | Western Africa
1.8
/100
|
#236
Tragic
$92,384
Immigrants | Bangladesh
1.7
/100
|
#237
Tragic
$92,208