Immigrants from Dominican Republic vs Korean Median Earnings
COMPARE
Immigrants from Dominican Republic
Korean
Median Earnings
Median Earnings Comparison
Immigrants from Dominican Republic
Koreans
$41,554
MEDIAN EARNINGS
0.1/ 100
METRIC RATING
288th/ 347
METRIC RANK
$48,727
MEDIAN EARNINGS
96.2/ 100
METRIC RATING
116th/ 347
METRIC RANK
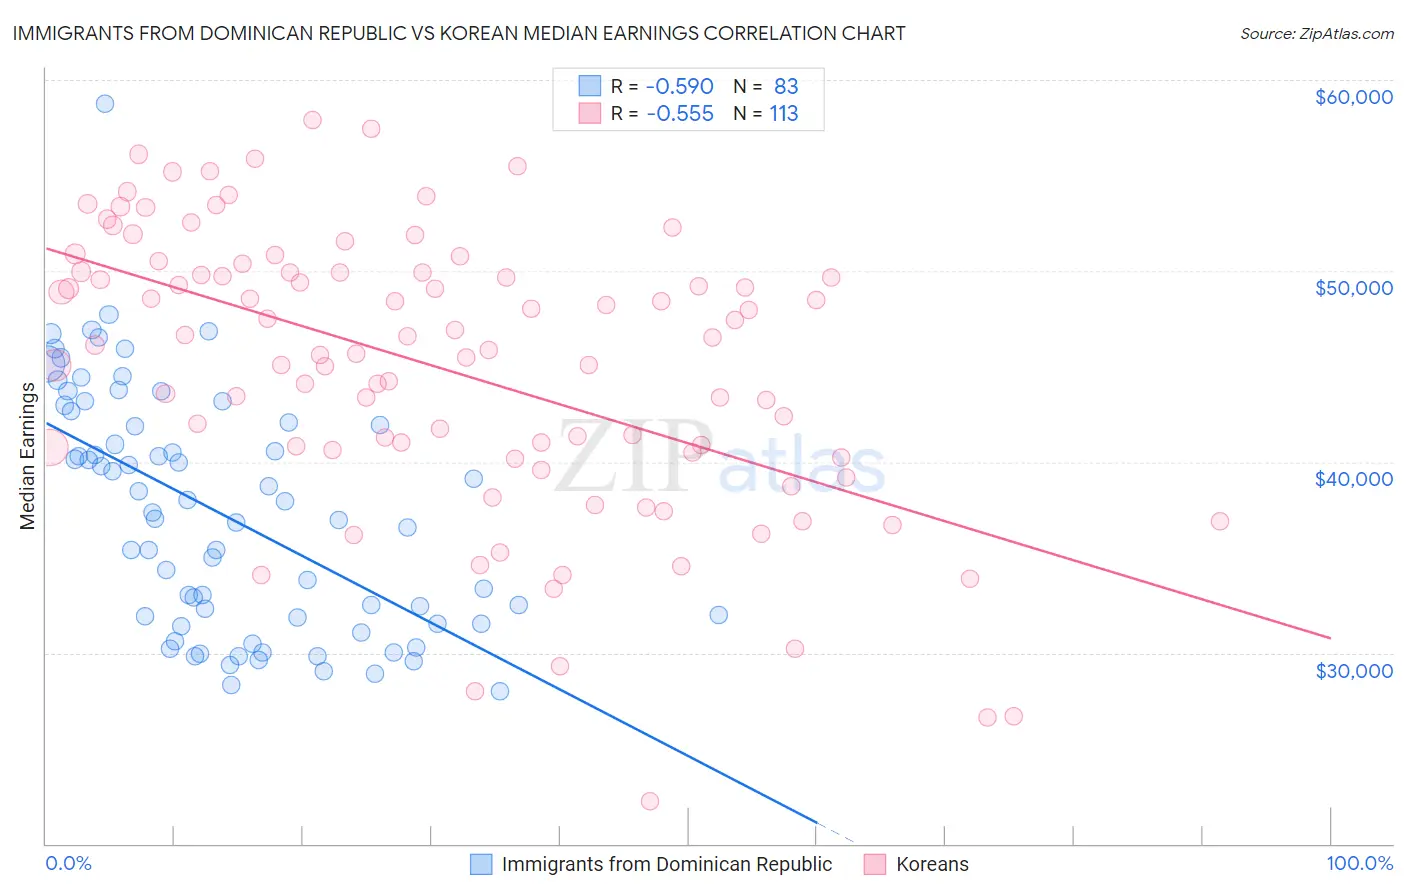
Immigrants from Dominican Republic vs Korean Median Earnings Correlation Chart
The statistical analysis conducted on geographies consisting of 275,134,235 people shows a substantial negative correlation between the proportion of Immigrants from Dominican Republic and median earnings in the United States with a correlation coefficient (R) of -0.590 and weighted average of $41,554. Similarly, the statistical analysis conducted on geographies consisting of 510,900,863 people shows a substantial negative correlation between the proportion of Koreans and median earnings in the United States with a correlation coefficient (R) of -0.555 and weighted average of $48,727, a difference of 17.3%.
Median Earnings Correlation Summary
| Measurement | Immigrants from Dominican Republic | Korean |
| Minimum | $28,009 | $22,216 |
| Maximum | $58,780 | $57,875 |
| Range | $30,771 | $35,659 |
| Mean | $37,276 | $44,924 |
| Median | $37,042 | $46,110 |
| Interquartile 25% (IQ1) | $31,535 | $40,528 |
| Interquartile 75% (IQ3) | $42,082 | $49,935 |
| Interquartile Range (IQR) | $10,547 | $9,407 |
| Standard Deviation (Sample) | $6,269 | $7,353 |
| Standard Deviation (Population) | $6,231 | $7,320 |
Similar Demographics by Median Earnings
Demographics Similar to Immigrants from Dominican Republic by Median Earnings
In terms of median earnings, the demographic groups most similar to Immigrants from Dominican Republic are Comanche ($41,519, a difference of 0.080%), Paiute ($41,508, a difference of 0.11%), Central American Indian ($41,474, a difference of 0.19%), U.S. Virgin Islander ($41,448, a difference of 0.26%), and Indonesian ($41,701, a difference of 0.35%).
| Demographics | Rating | Rank | Median Earnings |
| Marshallese | 0.2 /100 | #281 | Tragic $41,969 |
| Africans | 0.2 /100 | #282 | Tragic $41,955 |
| Dominicans | 0.2 /100 | #283 | Tragic $41,864 |
| Blackfeet | 0.2 /100 | #284 | Tragic $41,822 |
| Immigrants | Nicaragua | 0.1 /100 | #285 | Tragic $41,737 |
| Mexican American Indians | 0.1 /100 | #286 | Tragic $41,719 |
| Indonesians | 0.1 /100 | #287 | Tragic $41,701 |
| Immigrants | Dominican Republic | 0.1 /100 | #288 | Tragic $41,554 |
| Comanche | 0.1 /100 | #289 | Tragic $41,519 |
| Paiute | 0.1 /100 | #290 | Tragic $41,508 |
| Central American Indians | 0.1 /100 | #291 | Tragic $41,474 |
| U.S. Virgin Islanders | 0.1 /100 | #292 | Tragic $41,448 |
| Immigrants | Zaire | 0.1 /100 | #293 | Tragic $41,325 |
| Potawatomi | 0.1 /100 | #294 | Tragic $41,288 |
| Bangladeshis | 0.1 /100 | #295 | Tragic $41,263 |
Demographics Similar to Koreans by Median Earnings
In terms of median earnings, the demographic groups most similar to Koreans are Serbian ($48,677, a difference of 0.10%), Immigrants from Jordan ($48,673, a difference of 0.11%), Polish ($48,659, a difference of 0.14%), Chinese ($48,836, a difference of 0.22%), and Moroccan ($48,838, a difference of 0.23%).
| Demographics | Rating | Rank | Median Earnings |
| Syrians | 97.1 /100 | #109 | Exceptional $48,934 |
| Immigrants | Ethiopia | 97.1 /100 | #110 | Exceptional $48,924 |
| Immigrants | Zimbabwe | 97.0 /100 | #111 | Exceptional $48,913 |
| Northern Europeans | 96.9 /100 | #112 | Exceptional $48,887 |
| Immigrants | Kuwait | 96.8 /100 | #113 | Exceptional $48,861 |
| Moroccans | 96.7 /100 | #114 | Exceptional $48,838 |
| Chinese | 96.7 /100 | #115 | Exceptional $48,836 |
| Koreans | 96.2 /100 | #116 | Exceptional $48,727 |
| Serbians | 95.9 /100 | #117 | Exceptional $48,677 |
| Immigrants | Jordan | 95.9 /100 | #118 | Exceptional $48,673 |
| Poles | 95.8 /100 | #119 | Exceptional $48,659 |
| Carpatho Rusyns | 95.5 /100 | #120 | Exceptional $48,617 |
| Arabs | 95.4 /100 | #121 | Exceptional $48,599 |
| Chileans | 94.8 /100 | #122 | Exceptional $48,504 |
| Immigrants | Syria | 93.9 /100 | #123 | Exceptional $48,375 |