Immigrants from Denmark vs Ghanaian Householder Income Ages 45 - 64 years

COMPARE

Immigrants from Denmark
Race
Ancestry
AfghanAfricanAlaska NativeAlaskan AthabascanAlbanianAleutAlsatianAmericanApacheArabArapahoArgentineanArmenianAssyrian/Chaldean/SyriacAustralianAustrianBahamianBangladeshiBarbadianBasqueBelgianBelizeanBermudanBhutaneseBlackfeetBolivianBrazilianBritishBritish West IndianBulgarianBurmeseCajunCambodianCanadianCape VerdeanCarpatho RusynCelticCentral AmericanCentral American IndianCherokeeCheyenneChickasawChileanChineseChippewaChoctawColombianColvilleComancheCosta RicanCreeCreekCroatianCrowCubanCypriotCzechCzechoslovakianDanishDelawareDominicanDutchDutch West IndianEastern EuropeanEcuadorianEgyptianEnglishEstonianEthiopianEuropeanFijianFilipinoFinnishFrenchFrench American IndianFrench CanadianGermanGerman RussianGreekGuamanian/ChamorroGuatemalanGuyaneseHaitianHmongHonduranHopiHoumaHungarianIcelanderIndian (Asian)IndonesianInupiatIranianIraqiIrishIroquoisIsraeliItalianJamaicanJapaneseJordanianKenyanKiowaKoreanLaotianLatvianLebaneseLiberianLithuanianLumbeeLuxembourgerMacedonianMalaysianMalteseMarshalleseMenomineeMexicanMexican American IndianMongolianMoroccanNative HawaiianNavajoNepaleseNew ZealanderNicaraguanNigerianNorthern EuropeanNorwegianOkinawanOsageOttawaPaiutePakistaniPalestinianPanamanianParaguayanPennsylvania GermanPeruvianPimaPolishPortuguesePotawatomiPuebloPuerto RicanPuget Sound SalishRomanianRussianSalvadoranSamoanScandinavianScotch-IrishScottishSeminoleSenegaleseSerbianShoshoneSierra LeoneanSiouxSlavicSlovakSloveneSomaliSouth AfricanSouth AmericanSouth American IndianSoviet UnionSpaniardSpanishSpanish AmericanSpanish American IndianSri LankanSubsaharan AfricanSudaneseSwedishSwissSyrianTaiwaneseThaiTlingit-HaidaTohono O'OdhamTonganTrinidadian and TobagonianTsimshianTurkishU.S. Virgin IslanderUgandanUkrainianUruguayanUteVenezuelanVietnameseWelshWest IndianYakamaYaquiYugoslavianYumanYup'ikZimbabwean
Immigration
NonimmigrantsImmigrantsAfghanistanAfricaAlbaniaArgentinaArmeniaAsiaAustraliaAustriaBahamasBangladeshBarbadosBelarusBelgiumBelizeBoliviaBosnia and HerzegovinaBrazilBulgariaBurma/MyanmarCabo VerdeCambodiaCameroonCanadaCaribbeanCentral AmericaChileChinaColombiaCongoCosta RicaCroatiaCubaCzechoslovakiaDenmarkDominicaDominican RepublicEastern AfricaEastern AsiaEastern EuropeEcuadorEgyptEl SalvadorEnglandEritreaEthiopiaEuropeFijiFranceGermanyGhanaGreeceGrenadaGuatemalaGuyanaHaitiHondurasHong KongHungaryIndiaIndonesiaIranIraqIrelandIsraelItalyJamaicaJapanJordanKazakhstanKenyaKoreaKuwaitLaosLatin AmericaLatviaLebanonLiberiaLithuaniaMalaysiaMexicoMicronesiaMiddle AfricaMoldovaMoroccoNepalNetherlandsNicaraguaNigeriaNorth AmericaNorth MacedoniaNorthern AfricaNorthern EuropeNorwayOceaniaPakistanPanamaPeruPhilippinesPolandPortugalRomaniaRussiaSaudi ArabiaScotlandSenegalSerbiaSierra LeoneSingaporeSomaliaSouth AfricaSouth AmericaSouth Central AsiaSouth Eastern AsiaSouthern EuropeSpainSri LankaSt. Vincent and the GrenadinesSudanSwedenSwitzerlandSyriaTaiwanThailandTrinidad and TobagoTurkeyUgandaUkraineUruguayUzbekistanVenezuelaVietnamWest IndiesWestern AfricaWestern AsiaWestern EuropeYemenZaireZimbabweAzores
Ghanaian
Race
Ancestry
AfghanAfricanAlaska NativeAlaskan AthabascanAlbanianAleutAlsatianAmericanApacheArabArapahoArgentineanArmenianAssyrian/Chaldean/SyriacAustralianAustrianBahamianBangladeshiBarbadianBasqueBelgianBelizeanBermudanBhutaneseBlackfeetBolivianBrazilianBritishBritish West IndianBulgarianBurmeseCajunCambodianCanadianCape VerdeanCarpatho RusynCelticCentral AmericanCentral American IndianCherokeeCheyenneChickasawChileanChineseChippewaChoctawColombianColvilleComancheCosta RicanCreeCreekCroatianCrowCubanCypriotCzechCzechoslovakianDanishDelawareDominicanDutchDutch West IndianEastern EuropeanEcuadorianEgyptianEnglishEstonianEthiopianEuropeanFijianFilipinoFinnishFrenchFrench American IndianFrench CanadianGermanGerman RussianGhanaianGreekGuamanian/ChamorroGuatemalanGuyaneseHaitianHmongHonduranHopiHoumaHungarianIcelanderIndian (Asian)IndonesianInupiatIranianIraqiIrishIroquoisIsraeliItalianJamaicanJapaneseJordanianKenyanKiowaKoreanLaotianLatvianLebaneseLiberianLithuanianLumbeeLuxembourgerMacedonianMalaysianMalteseMarshalleseMenomineeMexicanMexican American IndianMongolianMoroccanNative HawaiianNavajoNepaleseNew ZealanderNicaraguanNigerianNorthern EuropeanNorwegianOkinawanOsageOttawaPaiutePakistaniPalestinianPanamanianParaguayanPennsylvania GermanPeruvianPimaPolishPortuguesePotawatomiPuebloPuerto RicanPuget Sound SalishRomanianRussianSalvadoranSamoanScandinavianScotch-IrishScottishSeminoleSenegaleseSerbianShoshoneSierra LeoneanSiouxSlavicSlovakSloveneSomaliSouth AfricanSouth AmericanSouth American IndianSoviet UnionSpaniardSpanishSpanish AmericanSpanish American IndianSri LankanSubsaharan AfricanSudaneseSwedishSwissSyrianTaiwaneseThaiTlingit-HaidaTohono O'OdhamTonganTrinidadian and TobagonianTsimshianTurkishU.S. Virgin IslanderUgandanUkrainianUruguayanUteVenezuelanVietnameseWelshWest IndianYakamaYaquiYugoslavianYumanYup'ikZimbabwean
Immigration
NonimmigrantsImmigrantsAfghanistanAfricaAlbaniaArgentinaArmeniaAsiaAustraliaAustriaBahamasBangladeshBarbadosBelarusBelgiumBelizeBoliviaBosnia and HerzegovinaBrazilBulgariaBurma/MyanmarCabo VerdeCambodiaCameroonCanadaCaribbeanCentral AmericaChileChinaColombiaCongoCosta RicaCroatiaCubaCzechoslovakiaDominicaDominican RepublicEastern AfricaEastern AsiaEastern EuropeEcuadorEgyptEl SalvadorEnglandEritreaEthiopiaEuropeFijiFranceGermanyGhanaGreeceGrenadaGuatemalaGuyanaHaitiHondurasHong KongHungaryIndiaIndonesiaIranIraqIrelandIsraelItalyJamaicaJapanJordanKazakhstanKenyaKoreaKuwaitLaosLatin AmericaLatviaLebanonLiberiaLithuaniaMalaysiaMexicoMicronesiaMiddle AfricaMoldovaMoroccoNepalNetherlandsNicaraguaNigeriaNorth AmericaNorth MacedoniaNorthern AfricaNorthern EuropeNorwayOceaniaPakistanPanamaPeruPhilippinesPolandPortugalRomaniaRussiaSaudi ArabiaScotlandSenegalSerbiaSierra LeoneSingaporeSomaliaSouth AfricaSouth AmericaSouth Central AsiaSouth Eastern AsiaSouthern EuropeSpainSri LankaSt. Vincent and the GrenadinesSudanSwedenSwitzerlandSyriaTaiwanThailandTrinidad and TobagoTurkeyUgandaUkraineUruguayUzbekistanVenezuelaVietnamWest IndiesWestern AfricaWestern AsiaWestern EuropeYemenZaireZimbabweAzores
Householder Income Ages 45 - 64 years
Income
Poverty
Unemployment
Labor Participation
Family Structure
Vehicle Availability
Education Level
Disability

Householder Income Ages 45 - 64 years Comparison

Immigrants from Denmark

Ghanaians

Exceptional
Poor
$116,000
HOUSEHOLDER INCOME AGES 45 - 64 YEARS
100.0/ 100
METRIC RATING
34th/ 347
METRIC RANK
$97,277
HOUSEHOLDER INCOME AGES 45 - 64 YEARS
17.9/ 100
METRIC RATING
207th/ 347
METRIC RANK

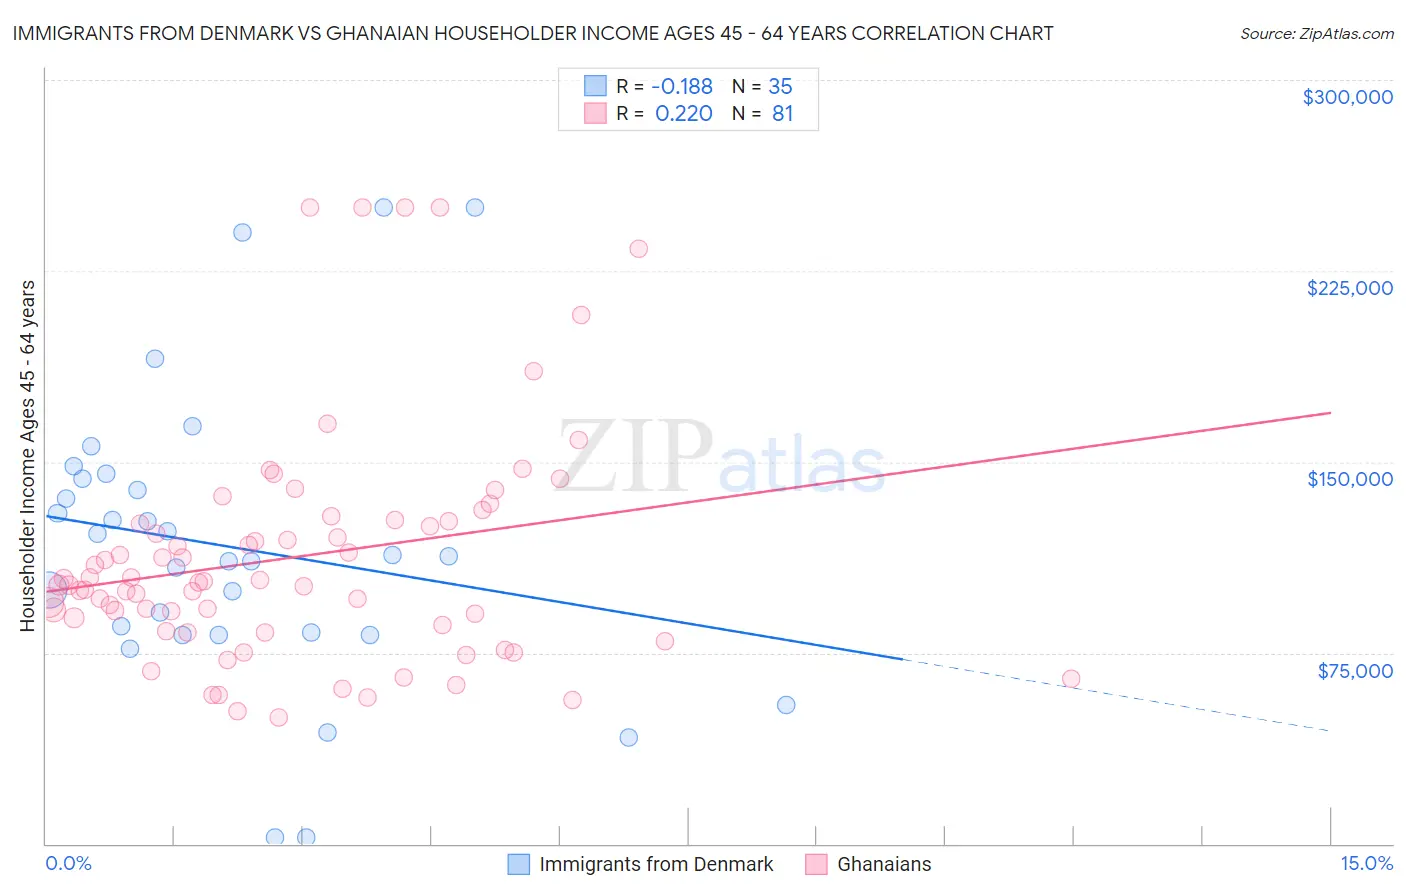
Immigrants from Denmark vs Ghanaian Householder Income Ages 45 - 64 years Correlation Chart

The statistical analysis conducted on geographies consisting of 136,366,596 people shows a poor negative correlation between the proportion of Immigrants from Denmark and household income with householder between the ages 45 and 64 in the United States with a correlation coefficient (R) of -0.188 and weighted average of $116,000. Similarly, the statistical analysis conducted on geographies consisting of 190,434,757 people shows a weak positive correlation between the proportion of Ghanaians and household income with householder between the ages 45 and 64 in the United States with a correlation coefficient (R) of 0.220 and weighted average of $97,277, a difference of 19.3%.
Immigrants from Denmark vs Ghanaian Householder Income Ages 45 - 64 years

Householder Income Ages 45 - 64 years Correlation Summary

MeasurementImmigrants from DenmarkGhanaian
Minimum$2,499$49,787
Maximum$250,001$250,001
Range$247,502$200,214
Mean$116,363$112,590
Median$112,813$102,711
Interquartile 25% (IQ1)$81,964$84,781
Interquartile 75% (IQ3)$143,426$126,915
Interquartile Range (IQR)$61,462$42,134
Standard Deviation (Sample)$57,800$45,701
Standard Deviation (Population)$56,968$45,418

Similar Demographics by Householder Income Ages 45 - 64 years

Demographics Similar to Immigrants from Denmark by Householder Income Ages 45 - 64 years

In terms of householder income ages 45 - 64 years, the demographic groups most similar to Immigrants from Denmark are Latvian ($115,957, a difference of 0.040%), Immigrants from Switzerland ($115,934, a difference of 0.060%), Chinese ($116,156, a difference of 0.13%), Russian ($116,328, a difference of 0.28%), and Immigrants from Asia ($116,566, a difference of 0.49%).
DemographicsRating | RankHouseholder Income Ages 45 - 64 years
Immigrants | Northern Europe
100.0
/100
|
#27
Exceptional
$117,930
Turks
100.0
/100
|
#28
Exceptional
$117,814
Bhutanese
100.0
/100
|
#29
Exceptional
$117,750
Immigrants | Bolivia
100.0
/100
|
#30
Exceptional
$117,731
Immigrants | Asia
100.0
/100
|
#31
Exceptional
$116,566
Russians
100.0
/100
|
#32
Exceptional
$116,328
Chinese
100.0
/100
|
#33
Exceptional
$116,156
Immigrants | Denmark
100.0
/100
|
#34
Exceptional
$116,000
Latvians
100.0
/100
|
#35
Exceptional
$115,957
Immigrants | Switzerland
100.0
/100
|
#36
Exceptional
$115,934
Maltese
99.9
/100
|
#37
Exceptional
$114,754
Immigrants | Pakistan
99.9
/100
|
#38
Exceptional
$114,434
Immigrants | Turkey
99.9
/100
|
#39
Exceptional
$114,407
Cambodians
99.9
/100
|
#40
Exceptional
$114,342
Immigrants | Lithuania
99.9
/100
|
#41
Exceptional
$114,336

Demographics Similar to Ghanaians by Householder Income Ages 45 - 64 years

In terms of householder income ages 45 - 64 years, the demographic groups most similar to Ghanaians are Immigrants from Colombia ($97,290, a difference of 0.010%), Immigrants from Africa ($97,284, a difference of 0.010%), Immigrants from Eritrea ($97,373, a difference of 0.10%), Immigrants from Thailand ($97,400, a difference of 0.13%), and Tlingit-Haida ($97,417, a difference of 0.14%).
DemographicsRating | RankHouseholder Income Ages 45 - 64 years
Immigrants | Kenya
23.5
/100
|
#200
Fair
$97,964
Yugoslavians
20.0
/100
|
#201
Fair
$97,558
Tlingit-Haida
18.9
/100
|
#202
Poor
$97,417
Immigrants | Thailand
18.8
/100
|
#203
Poor
$97,400
Immigrants | Eritrea
18.6
/100
|
#204
Poor
$97,373
Immigrants | Colombia
18.0
/100
|
#205
Poor
$97,290
Immigrants | Africa
17.9
/100
|
#206
Poor
$97,284
Ghanaians
17.9
/100
|
#207
Poor
$97,277
Scotch-Irish
16.4
/100
|
#208
Poor
$97,073
Japanese
14.8
/100
|
#209
Poor
$96,834
Tsimshian
14.5
/100
|
#210
Poor
$96,783
Immigrants | Cambodia
13.0
/100
|
#211
Poor
$96,537
Venezuelans
12.6
/100
|
#212
Poor
$96,460
Immigrants | Uruguay
10.7
/100
|
#213
Poor
$96,086
Panamanians
10.6
/100
|
#214
Poor
$96,066