Immigrants from Costa Rica vs Subsaharan African Householder Income Ages 45 - 64 years
COMPARE
Immigrants from Costa Rica
Subsaharan African
Householder Income Ages 45 - 64 years
Householder Income Ages 45 - 64 years Comparison
Immigrants from Costa Rica
Sub-Saharan Africans
$100,141
HOUSEHOLDER INCOME AGES 45 - 64 YEARS
47.7/ 100
METRIC RATING
176th/ 347
METRIC RANK
$90,691
HOUSEHOLDER INCOME AGES 45 - 64 YEARS
0.8/ 100
METRIC RATING
250th/ 347
METRIC RANK
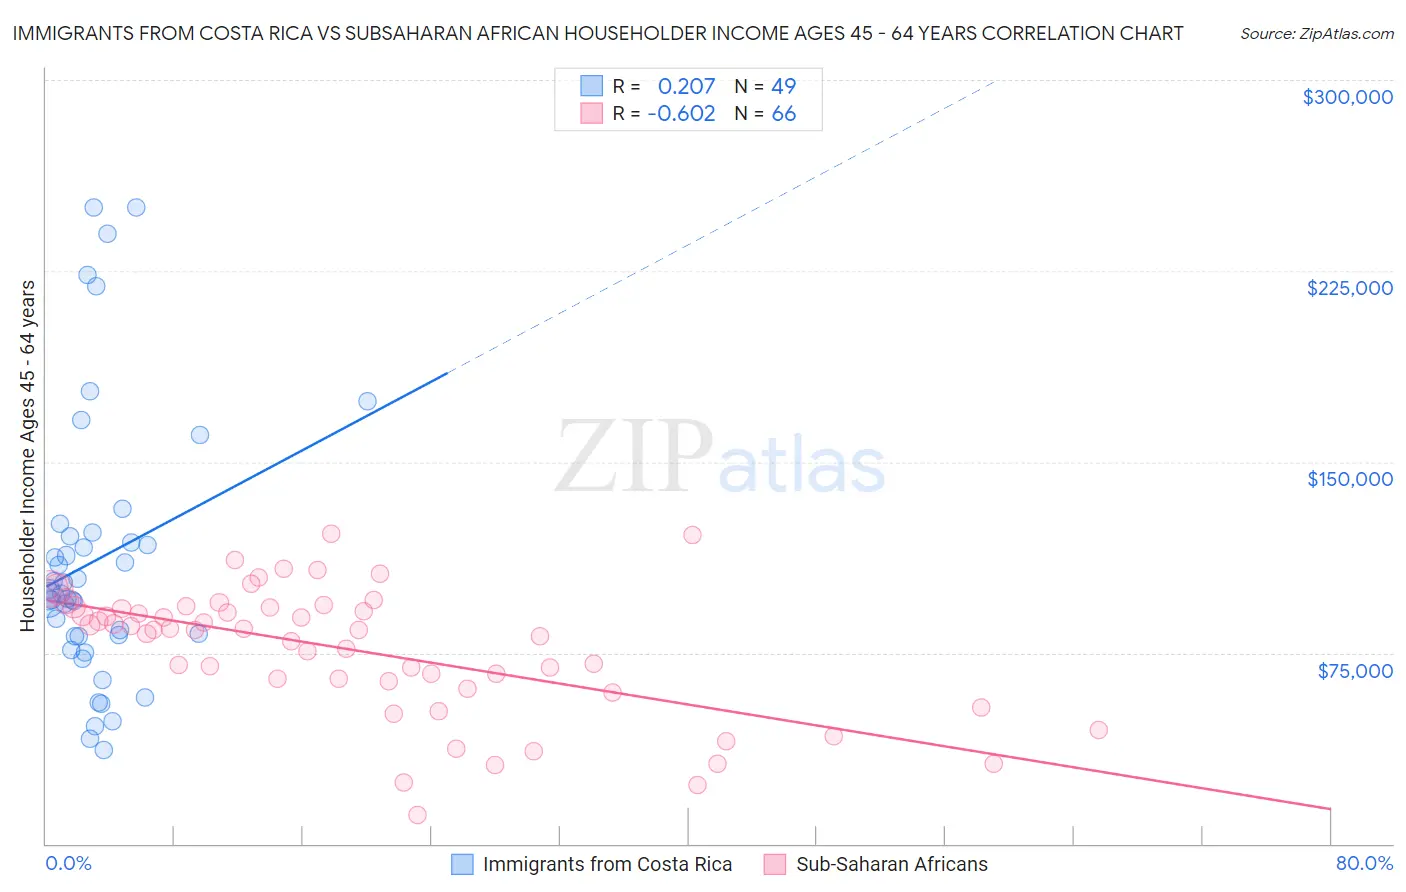
Immigrants from Costa Rica vs Subsaharan African Householder Income Ages 45 - 64 years Correlation Chart
The statistical analysis conducted on geographies consisting of 204,163,177 people shows a weak positive correlation between the proportion of Immigrants from Costa Rica and household income with householder between the ages 45 and 64 in the United States with a correlation coefficient (R) of 0.207 and weighted average of $100,141. Similarly, the statistical analysis conducted on geographies consisting of 506,198,662 people shows a significant negative correlation between the proportion of Sub-Saharan Africans and household income with householder between the ages 45 and 64 in the United States with a correlation coefficient (R) of -0.602 and weighted average of $90,691, a difference of 10.4%.
Householder Income Ages 45 - 64 years Correlation Summary
| Measurement | Immigrants from Costa Rica | Subsaharan African |
| Minimum | $36,667 | $11,458 |
| Maximum | $250,001 | $121,610 |
| Range | $213,334 | $110,152 |
| Mean | $111,542 | $76,045 |
| Median | $98,012 | $84,198 |
| Interquartile 25% (IQ1) | $81,355 | $64,056 |
| Interquartile 75% (IQ3) | $121,642 | $92,645 |
| Interquartile Range (IQR) | $40,287 | $28,589 |
| Standard Deviation (Sample) | $53,037 | $25,098 |
| Standard Deviation (Population) | $52,493 | $24,907 |
Similar Demographics by Householder Income Ages 45 - 64 years
Demographics Similar to Immigrants from Costa Rica by Householder Income Ages 45 - 64 years
In terms of householder income ages 45 - 64 years, the demographic groups most similar to Immigrants from Costa Rica are Moroccan ($100,138, a difference of 0.0%), Immigrants from Cameroon ($100,084, a difference of 0.060%), German ($100,224, a difference of 0.080%), Belgian ($100,060, a difference of 0.080%), and Aleut ($100,052, a difference of 0.090%).
| Demographics | Rating | Rank | Householder Income Ages 45 - 64 years |
| Guamanians/Chamorros | 60.5 /100 | #169 | Good $101,170 |
| Slovaks | 58.8 /100 | #170 | Average $101,029 |
| South Americans | 56.4 /100 | #171 | Average $100,837 |
| Immigrants | Uzbekistan | 52.5 /100 | #172 | Average $100,523 |
| Alsatians | 51.4 /100 | #173 | Average $100,435 |
| Welsh | 50.0 /100 | #174 | Average $100,322 |
| Germans | 48.8 /100 | #175 | Average $100,224 |
| Immigrants | Costa Rica | 47.7 /100 | #176 | Average $100,141 |
| Moroccans | 47.7 /100 | #177 | Average $100,138 |
| Immigrants | Cameroon | 47.0 /100 | #178 | Average $100,084 |
| Belgians | 46.7 /100 | #179 | Average $100,060 |
| Aleuts | 46.6 /100 | #180 | Average $100,052 |
| Immigrants | Immigrants | 45.3 /100 | #181 | Average $99,943 |
| Finns | 44.8 /100 | #182 | Average $99,904 |
| Spaniards | 44.6 /100 | #183 | Average $99,889 |
Demographics Similar to Sub-Saharan Africans by Householder Income Ages 45 - 64 years
In terms of householder income ages 45 - 64 years, the demographic groups most similar to Sub-Saharan Africans are Mexican American Indian ($90,811, a difference of 0.13%), American ($90,536, a difference of 0.17%), Immigrants from Laos ($90,909, a difference of 0.24%), Marshallese ($90,455, a difference of 0.26%), and Central American ($90,951, a difference of 0.29%).
| Demographics | Rating | Rank | Householder Income Ages 45 - 64 years |
| Immigrants | Trinidad and Tobago | 1.1 /100 | #243 | Tragic $91,347 |
| Immigrants | Middle Africa | 1.1 /100 | #244 | Tragic $91,293 |
| Guyanese | 0.9 /100 | #245 | Tragic $90,966 |
| Central Americans | 0.9 /100 | #246 | Tragic $90,951 |
| Alaskan Athabascans | 0.9 /100 | #247 | Tragic $90,951 |
| Immigrants | Laos | 0.9 /100 | #248 | Tragic $90,909 |
| Mexican American Indians | 0.8 /100 | #249 | Tragic $90,811 |
| Sub-Saharan Africans | 0.8 /100 | #250 | Tragic $90,691 |
| Americans | 0.7 /100 | #251 | Tragic $90,536 |
| Marshallese | 0.7 /100 | #252 | Tragic $90,455 |
| Barbadians | 0.6 /100 | #253 | Tragic $90,266 |
| Immigrants | Guyana | 0.6 /100 | #254 | Tragic $90,186 |
| West Indians | 0.5 /100 | #255 | Tragic $89,906 |
| French American Indians | 0.5 /100 | #256 | Tragic $89,811 |
| German Russians | 0.4 /100 | #257 | Tragic $89,398 |