Immigrants from Chile vs Immigrants from Malaysia Median Female Earnings

COMPARE

Immigrants from Chile
Race
Ancestry
AfghanAfricanAlaska NativeAlaskan AthabascanAlbanianAleutAlsatianAmericanApacheArabArapahoArgentineanArmenianAssyrian/Chaldean/SyriacAustralianAustrianBahamianBangladeshiBarbadianBasqueBelgianBelizeanBermudanBhutaneseBlackfeetBolivianBrazilianBritishBritish West IndianBulgarianBurmeseCajunCambodianCanadianCape VerdeanCarpatho RusynCelticCentral AmericanCentral American IndianCherokeeCheyenneChickasawChileanChineseChippewaChoctawColombianColvilleComancheCosta RicanCreeCreekCroatianCrowCubanCypriotCzechCzechoslovakianDanishDelawareDominicanDutchDutch West IndianEastern EuropeanEcuadorianEgyptianEnglishEstonianEthiopianEuropeanFijianFilipinoFinnishFrenchFrench American IndianFrench CanadianGermanGerman RussianGhanaianGreekGuamanian/ChamorroGuatemalanGuyaneseHaitianHmongHonduranHopiHoumaHungarianIcelanderIndian (Asian)IndonesianInupiatIranianIraqiIrishIroquoisIsraeliItalianJamaicanJapaneseJordanianKenyanKiowaKoreanLaotianLatvianLebaneseLiberianLithuanianLumbeeLuxembourgerMacedonianMalaysianMalteseMarshalleseMenomineeMexicanMexican American IndianMongolianMoroccanNative HawaiianNavajoNepaleseNew ZealanderNicaraguanNigerianNorthern EuropeanNorwegianOkinawanOsageOttawaPaiutePakistaniPalestinianPanamanianParaguayanPennsylvania GermanPeruvianPimaPolishPortuguesePotawatomiPuebloPuerto RicanPuget Sound SalishRomanianRussianSalvadoranSamoanScandinavianScotch-IrishScottishSeminoleSenegaleseSerbianShoshoneSierra LeoneanSiouxSlavicSlovakSloveneSomaliSouth AfricanSouth AmericanSouth American IndianSoviet UnionSpaniardSpanishSpanish AmericanSpanish American IndianSri LankanSubsaharan AfricanSudaneseSwedishSwissSyrianTaiwaneseThaiTlingit-HaidaTohono O'OdhamTonganTrinidadian and TobagonianTsimshianTurkishU.S. Virgin IslanderUgandanUkrainianUruguayanUteVenezuelanVietnameseWelshWest IndianYakamaYaquiYugoslavianYumanYup'ikZimbabwean
Immigration
NonimmigrantsImmigrantsAfghanistanAfricaAlbaniaArgentinaArmeniaAsiaAustraliaAustriaBahamasBangladeshBarbadosBelarusBelgiumBelizeBoliviaBosnia and HerzegovinaBrazilBulgariaBurma/MyanmarCabo VerdeCambodiaCameroonCanadaCaribbeanCentral AmericaChileChinaColombiaCongoCosta RicaCroatiaCubaCzechoslovakiaDenmarkDominicaDominican RepublicEastern AfricaEastern AsiaEastern EuropeEcuadorEgyptEl SalvadorEnglandEritreaEthiopiaEuropeFijiFranceGermanyGhanaGreeceGrenadaGuatemalaGuyanaHaitiHondurasHong KongHungaryIndiaIndonesiaIranIraqIrelandIsraelItalyJamaicaJapanJordanKazakhstanKenyaKoreaKuwaitLaosLatin AmericaLatviaLebanonLiberiaLithuaniaMexicoMicronesiaMiddle AfricaMoldovaMoroccoNepalNetherlandsNicaraguaNigeriaNorth AmericaNorth MacedoniaNorthern AfricaNorthern EuropeNorwayOceaniaPakistanPanamaPeruPhilippinesPolandPortugalRomaniaRussiaSaudi ArabiaScotlandSenegalSerbiaSierra LeoneSingaporeSomaliaSouth AfricaSouth AmericaSouth Central AsiaSouth Eastern AsiaSouthern EuropeSpainSri LankaSt. Vincent and the GrenadinesSudanSwedenSwitzerlandSyriaTaiwanThailandTrinidad and TobagoTurkeyUgandaUkraineUruguayUzbekistanVenezuelaVietnamWest IndiesWestern AfricaWestern AsiaWestern EuropeYemenZaireZimbabweAzores
Immigrants from Malaysia
Race
Ancestry
AfghanAfricanAlaska NativeAlaskan AthabascanAlbanianAleutAlsatianAmericanApacheArabArapahoArgentineanArmenianAssyrian/Chaldean/SyriacAustralianAustrianBahamianBangladeshiBarbadianBasqueBelgianBelizeanBermudanBhutaneseBlackfeetBolivianBrazilianBritishBritish West IndianBulgarianBurmeseCajunCambodianCanadianCape VerdeanCarpatho RusynCelticCentral AmericanCentral American IndianCherokeeCheyenneChickasawChileanChineseChippewaChoctawColombianColvilleComancheCosta RicanCreeCreekCroatianCrowCubanCypriotCzechCzechoslovakianDanishDelawareDominicanDutchDutch West IndianEastern EuropeanEcuadorianEgyptianEnglishEstonianEthiopianEuropeanFijianFilipinoFinnishFrenchFrench American IndianFrench CanadianGermanGerman RussianGhanaianGreekGuamanian/ChamorroGuatemalanGuyaneseHaitianHmongHonduranHopiHoumaHungarianIcelanderIndian (Asian)IndonesianInupiatIranianIraqiIrishIroquoisIsraeliItalianJamaicanJapaneseJordanianKenyanKiowaKoreanLaotianLatvianLebaneseLiberianLithuanianLumbeeLuxembourgerMacedonianMalaysianMalteseMarshalleseMenomineeMexicanMexican American IndianMongolianMoroccanNative HawaiianNavajoNepaleseNew ZealanderNicaraguanNigerianNorthern EuropeanNorwegianOkinawanOsageOttawaPaiutePakistaniPalestinianPanamanianParaguayanPennsylvania GermanPeruvianPimaPolishPortuguesePotawatomiPuebloPuerto RicanPuget Sound SalishRomanianRussianSalvadoranSamoanScandinavianScotch-IrishScottishSeminoleSenegaleseSerbianShoshoneSierra LeoneanSiouxSlavicSlovakSloveneSomaliSouth AfricanSouth AmericanSouth American IndianSoviet UnionSpaniardSpanishSpanish AmericanSpanish American IndianSri LankanSubsaharan AfricanSudaneseSwedishSwissSyrianTaiwaneseThaiTlingit-HaidaTohono O'OdhamTonganTrinidadian and TobagonianTsimshianTurkishU.S. Virgin IslanderUgandanUkrainianUruguayanUteVenezuelanVietnameseWelshWest IndianYakamaYaquiYugoslavianYumanYup'ikZimbabwean
Immigration
NonimmigrantsImmigrantsAfghanistanAfricaAlbaniaArgentinaArmeniaAsiaAustraliaAustriaBahamasBangladeshBarbadosBelarusBelgiumBelizeBoliviaBosnia and HerzegovinaBrazilBulgariaBurma/MyanmarCabo VerdeCambodiaCameroonCanadaCaribbeanCentral AmericaChinaColombiaCongoCosta RicaCroatiaCubaCzechoslovakiaDenmarkDominicaDominican RepublicEastern AfricaEastern AsiaEastern EuropeEcuadorEgyptEl SalvadorEnglandEritreaEthiopiaEuropeFijiFranceGermanyGhanaGreeceGrenadaGuatemalaGuyanaHaitiHondurasHong KongHungaryIndiaIndonesiaIranIraqIrelandIsraelItalyJamaicaJapanJordanKazakhstanKenyaKoreaKuwaitLaosLatin AmericaLatviaLebanonLiberiaLithuaniaMalaysiaMexicoMicronesiaMiddle AfricaMoldovaMoroccoNepalNetherlandsNicaraguaNigeriaNorth AmericaNorth MacedoniaNorthern AfricaNorthern EuropeNorwayOceaniaPakistanPanamaPeruPhilippinesPolandPortugalRomaniaRussiaSaudi ArabiaScotlandSenegalSerbiaSierra LeoneSingaporeSomaliaSouth AfricaSouth AmericaSouth Central AsiaSouth Eastern AsiaSouthern EuropeSpainSri LankaSt. Vincent and the GrenadinesSudanSwedenSwitzerlandSyriaTaiwanThailandTrinidad and TobagoTurkeyUgandaUkraineUruguayUzbekistanVenezuelaVietnamWest IndiesWestern AfricaWestern AsiaWestern EuropeYemenZaireZimbabweAzores
Median Female Earnings
Income
Poverty
Unemployment
Labor Participation
Family Structure
Vehicle Availability
Education Level
Disability

Median Female Earnings Comparison

Immigrants from Chile

Immigrants from Malaysia

Good
Exceptional
$40,353
MEDIAN FEMALE EARNINGS
79.6/ 100
METRIC RATING
150th/ 347
METRIC RANK
$43,835
MEDIAN FEMALE EARNINGS
100.0/ 100
METRIC RATING
40th/ 347
METRIC RANK

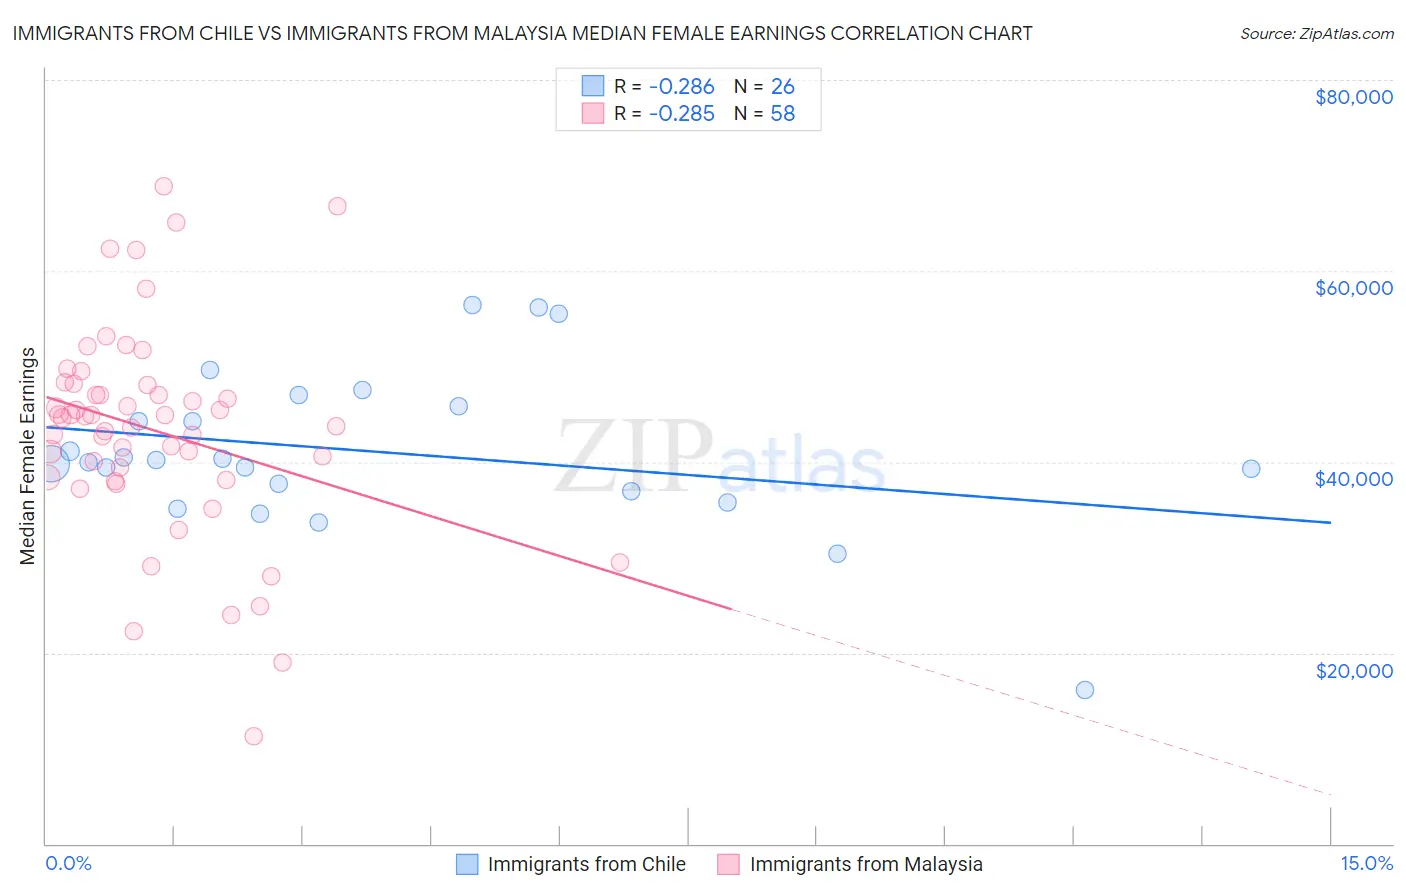
Immigrants from Chile vs Immigrants from Malaysia Median Female Earnings Correlation Chart

The statistical analysis conducted on geographies consisting of 218,612,520 people shows a weak negative correlation between the proportion of Immigrants from Chile and median female earnings in the United States with a correlation coefficient (R) of -0.286 and weighted average of $40,353. Similarly, the statistical analysis conducted on geographies consisting of 197,943,431 people shows a weak negative correlation between the proportion of Immigrants from Malaysia and median female earnings in the United States with a correlation coefficient (R) of -0.285 and weighted average of $43,835, a difference of 8.6%.
Immigrants from Chile vs Immigrants from Malaysia Median Female Earnings

Median Female Earnings Correlation Summary

MeasurementImmigrants from ChileImmigrants from Malaysia
Minimum$16,042$11,250
Maximum$56,442$68,919
Range$40,400$57,669
Mean$41,031$43,300
Median$40,109$44,670
Interquartile 25% (IQ1)$36,875$38,363
Interquartile 75% (IQ3)$45,789$48,104
Interquartile Range (IQR)$8,914$9,741
Standard Deviation (Sample)$8,520$11,057
Standard Deviation (Population)$8,355$10,961

Similar Demographics by Median Female Earnings

Demographics Similar to Immigrants from Chile by Median Female Earnings

In terms of median female earnings, the demographic groups most similar to Immigrants from Chile are Immigrants from Cameroon ($40,354, a difference of 0.0%), Immigrants from Armenia ($40,340, a difference of 0.030%), Polish ($40,371, a difference of 0.040%), Vietnamese ($40,377, a difference of 0.060%), and West Indian ($40,317, a difference of 0.090%).
DemographicsRating | RankMedian Female Earnings
Northern Europeans
83.9
/100
|
#143
Excellent
$40,491
Immigrants | North Macedonia
83.8
/100
|
#144
Excellent
$40,488
Brazilians
83.6
/100
|
#145
Excellent
$40,483
Ghanaians
82.1
/100
|
#146
Excellent
$40,429
Vietnamese
80.4
/100
|
#147
Excellent
$40,377
Poles
80.2
/100
|
#148
Excellent
$40,371
Immigrants | Cameroon
79.7
/100
|
#149
Good
$40,354
Immigrants | Chile
79.6
/100
|
#150
Good
$40,353
Immigrants | Armenia
79.2
/100
|
#151
Good
$40,340
West Indians
78.4
/100
|
#152
Good
$40,317
British West Indians
77.7
/100
|
#153
Good
$40,299
Immigrants | Oceania
77.6
/100
|
#154
Good
$40,297
Immigrants | Africa
76.2
/100
|
#155
Good
$40,257
Peruvians
75.3
/100
|
#156
Good
$40,234
Portuguese
73.0
/100
|
#157
Good
$40,177

Demographics Similar to Immigrants from Malaysia by Median Female Earnings

In terms of median female earnings, the demographic groups most similar to Immigrants from Malaysia are Israeli ($43,852, a difference of 0.040%), Latvian ($43,941, a difference of 0.24%), Immigrants from Switzerland ($43,996, a difference of 0.37%), Bhutanese ($43,648, a difference of 0.43%), and Immigrants from Denmark ($43,646, a difference of 0.43%).
DemographicsRating | RankMedian Female Earnings
Immigrants | Asia
100.0
/100
|
#33
Exceptional
$44,198
Russians
100.0
/100
|
#34
Exceptional
$44,169
Immigrants | Sri Lanka
100.0
/100
|
#35
Exceptional
$44,161
Immigrants | Turkey
100.0
/100
|
#36
Exceptional
$44,066
Immigrants | Switzerland
100.0
/100
|
#37
Exceptional
$43,996
Latvians
100.0
/100
|
#38
Exceptional
$43,941
Israelis
100.0
/100
|
#39
Exceptional
$43,852
Immigrants | Malaysia
100.0
/100
|
#40
Exceptional
$43,835
Bhutanese
100.0
/100
|
#41
Exceptional
$43,648
Immigrants | Denmark
100.0
/100
|
#42
Exceptional
$43,646
Bulgarians
100.0
/100
|
#43
Exceptional
$43,638
Immigrants | Czechoslovakia
100.0
/100
|
#44
Exceptional
$43,571
Immigrants | Europe
100.0
/100
|
#45
Exceptional
$43,523
Immigrants | Bolivia
100.0
/100
|
#46
Exceptional
$43,467
Bolivians
100.0
/100
|
#47
Exceptional
$43,445