Immigrants from Cameroon vs Immigrants from Ethiopia Householder Income Ages 45 - 64 years

COMPARE

Immigrants from Cameroon
Race
Ancestry
AfghanAfricanAlaska NativeAlaskan AthabascanAlbanianAleutAlsatianAmericanApacheArabArapahoArgentineanArmenianAssyrian/Chaldean/SyriacAustralianAustrianBahamianBangladeshiBarbadianBasqueBelgianBelizeanBermudanBhutaneseBlackfeetBolivianBrazilianBritishBritish West IndianBulgarianBurmeseCajunCambodianCanadianCape VerdeanCarpatho RusynCelticCentral AmericanCentral American IndianCherokeeCheyenneChickasawChileanChineseChippewaChoctawColombianColvilleComancheCosta RicanCreeCreekCroatianCrowCubanCypriotCzechCzechoslovakianDanishDelawareDominicanDutchDutch West IndianEastern EuropeanEcuadorianEgyptianEnglishEstonianEthiopianEuropeanFijianFilipinoFinnishFrenchFrench American IndianFrench CanadianGermanGerman RussianGhanaianGreekGuamanian/ChamorroGuatemalanGuyaneseHaitianHmongHonduranHopiHoumaHungarianIcelanderIndian (Asian)IndonesianInupiatIranianIraqiIrishIroquoisIsraeliItalianJamaicanJapaneseJordanianKenyanKiowaKoreanLaotianLatvianLebaneseLiberianLithuanianLumbeeLuxembourgerMacedonianMalaysianMalteseMarshalleseMenomineeMexicanMexican American IndianMongolianMoroccanNative HawaiianNavajoNepaleseNew ZealanderNicaraguanNigerianNorthern EuropeanNorwegianOkinawanOsageOttawaPaiutePakistaniPalestinianPanamanianParaguayanPennsylvania GermanPeruvianPimaPolishPortuguesePotawatomiPuebloPuerto RicanPuget Sound SalishRomanianRussianSalvadoranSamoanScandinavianScotch-IrishScottishSeminoleSenegaleseSerbianShoshoneSierra LeoneanSiouxSlavicSlovakSloveneSomaliSouth AfricanSouth AmericanSouth American IndianSoviet UnionSpaniardSpanishSpanish AmericanSpanish American IndianSri LankanSubsaharan AfricanSudaneseSwedishSwissSyrianTaiwaneseThaiTlingit-HaidaTohono O'OdhamTonganTrinidadian and TobagonianTsimshianTurkishU.S. Virgin IslanderUgandanUkrainianUruguayanUteVenezuelanVietnameseWelshWest IndianYakamaYaquiYugoslavianYumanYup'ikZimbabwean
Immigration
NonimmigrantsImmigrantsAfghanistanAfricaAlbaniaArgentinaArmeniaAsiaAustraliaAustriaBahamasBangladeshBarbadosBelarusBelgiumBelizeBoliviaBosnia and HerzegovinaBrazilBulgariaBurma/MyanmarCabo VerdeCambodiaCameroonCanadaCaribbeanCentral AmericaChileChinaColombiaCongoCosta RicaCroatiaCubaCzechoslovakiaDenmarkDominicaDominican RepublicEastern AfricaEastern AsiaEastern EuropeEcuadorEgyptEl SalvadorEnglandEritreaEuropeFijiFranceGermanyGhanaGreeceGrenadaGuatemalaGuyanaHaitiHondurasHong KongHungaryIndiaIndonesiaIranIraqIrelandIsraelItalyJamaicaJapanJordanKazakhstanKenyaKoreaKuwaitLaosLatin AmericaLatviaLebanonLiberiaLithuaniaMalaysiaMexicoMicronesiaMiddle AfricaMoldovaMoroccoNepalNetherlandsNicaraguaNigeriaNorth AmericaNorth MacedoniaNorthern AfricaNorthern EuropeNorwayOceaniaPakistanPanamaPeruPhilippinesPolandPortugalRomaniaRussiaSaudi ArabiaScotlandSenegalSerbiaSierra LeoneSingaporeSomaliaSouth AfricaSouth AmericaSouth Central AsiaSouth Eastern AsiaSouthern EuropeSpainSri LankaSt. Vincent and the GrenadinesSudanSwedenSwitzerlandSyriaTaiwanThailandTrinidad and TobagoTurkeyUgandaUkraineUruguayUzbekistanVenezuelaVietnamWest IndiesWestern AfricaWestern AsiaWestern EuropeYemenZaireZimbabweAzores
Immigrants from Ethiopia
Race
Ancestry
AfghanAfricanAlaska NativeAlaskan AthabascanAlbanianAleutAlsatianAmericanApacheArabArapahoArgentineanArmenianAssyrian/Chaldean/SyriacAustralianAustrianBahamianBangladeshiBarbadianBasqueBelgianBelizeanBermudanBhutaneseBlackfeetBolivianBrazilianBritishBritish West IndianBulgarianBurmeseCajunCambodianCanadianCape VerdeanCarpatho RusynCelticCentral AmericanCentral American IndianCherokeeCheyenneChickasawChileanChineseChippewaChoctawColombianColvilleComancheCosta RicanCreeCreekCroatianCrowCubanCypriotCzechCzechoslovakianDanishDelawareDominicanDutchDutch West IndianEastern EuropeanEcuadorianEgyptianEnglishEstonianEthiopianEuropeanFijianFilipinoFinnishFrenchFrench American IndianFrench CanadianGermanGerman RussianGhanaianGreekGuamanian/ChamorroGuatemalanGuyaneseHaitianHmongHonduranHopiHoumaHungarianIcelanderIndian (Asian)IndonesianInupiatIranianIraqiIrishIroquoisIsraeliItalianJamaicanJapaneseJordanianKenyanKiowaKoreanLaotianLatvianLebaneseLiberianLithuanianLumbeeLuxembourgerMacedonianMalaysianMalteseMarshalleseMenomineeMexicanMexican American IndianMongolianMoroccanNative HawaiianNavajoNepaleseNew ZealanderNicaraguanNigerianNorthern EuropeanNorwegianOkinawanOsageOttawaPaiutePakistaniPalestinianPanamanianParaguayanPennsylvania GermanPeruvianPimaPolishPortuguesePotawatomiPuebloPuerto RicanPuget Sound SalishRomanianRussianSalvadoranSamoanScandinavianScotch-IrishScottishSeminoleSenegaleseSerbianShoshoneSierra LeoneanSiouxSlavicSlovakSloveneSomaliSouth AfricanSouth AmericanSouth American IndianSoviet UnionSpaniardSpanishSpanish AmericanSpanish American IndianSri LankanSubsaharan AfricanSudaneseSwedishSwissSyrianTaiwaneseThaiTlingit-HaidaTohono O'OdhamTonganTrinidadian and TobagonianTsimshianTurkishU.S. Virgin IslanderUgandanUkrainianUruguayanUteVenezuelanVietnameseWelshWest IndianYakamaYaquiYugoslavianYumanYup'ikZimbabwean
Immigration
NonimmigrantsImmigrantsAfghanistanAfricaAlbaniaArgentinaArmeniaAsiaAustraliaAustriaBahamasBangladeshBarbadosBelarusBelgiumBelizeBoliviaBosnia and HerzegovinaBrazilBulgariaBurma/MyanmarCabo VerdeCambodiaCanadaCaribbeanCentral AmericaChileChinaColombiaCongoCosta RicaCroatiaCubaCzechoslovakiaDenmarkDominicaDominican RepublicEastern AfricaEastern AsiaEastern EuropeEcuadorEgyptEl SalvadorEnglandEritreaEthiopiaEuropeFijiFranceGermanyGhanaGreeceGrenadaGuatemalaGuyanaHaitiHondurasHong KongHungaryIndiaIndonesiaIranIraqIrelandIsraelItalyJamaicaJapanJordanKazakhstanKenyaKoreaKuwaitLaosLatin AmericaLatviaLebanonLiberiaLithuaniaMalaysiaMexicoMicronesiaMiddle AfricaMoldovaMoroccoNepalNetherlandsNicaraguaNigeriaNorth AmericaNorth MacedoniaNorthern AfricaNorthern EuropeNorwayOceaniaPakistanPanamaPeruPhilippinesPolandPortugalRomaniaRussiaSaudi ArabiaScotlandSenegalSerbiaSierra LeoneSingaporeSomaliaSouth AfricaSouth AmericaSouth Central AsiaSouth Eastern AsiaSouthern EuropeSpainSri LankaSt. Vincent and the GrenadinesSudanSwedenSwitzerlandSyriaTaiwanThailandTrinidad and TobagoTurkeyUgandaUkraineUruguayUzbekistanVenezuelaVietnamWest IndiesWestern AfricaWestern AsiaWestern EuropeYemenZaireZimbabweAzores
Householder Income Ages 45 - 64 years
Income
Poverty
Unemployment
Labor Participation
Family Structure
Vehicle Availability
Education Level
Disability

Householder Income Ages 45 - 64 years Comparison

Immigrants from Cameroon

Immigrants from Ethiopia

Average
Good
$100,084
HOUSEHOLDER INCOME AGES 45 - 64 YEARS
47.0/ 100
METRIC RATING
178th/ 347
METRIC RANK
$102,763
HOUSEHOLDER INCOME AGES 45 - 64 YEARS
77.3/ 100
METRIC RATING
157th/ 347
METRIC RANK

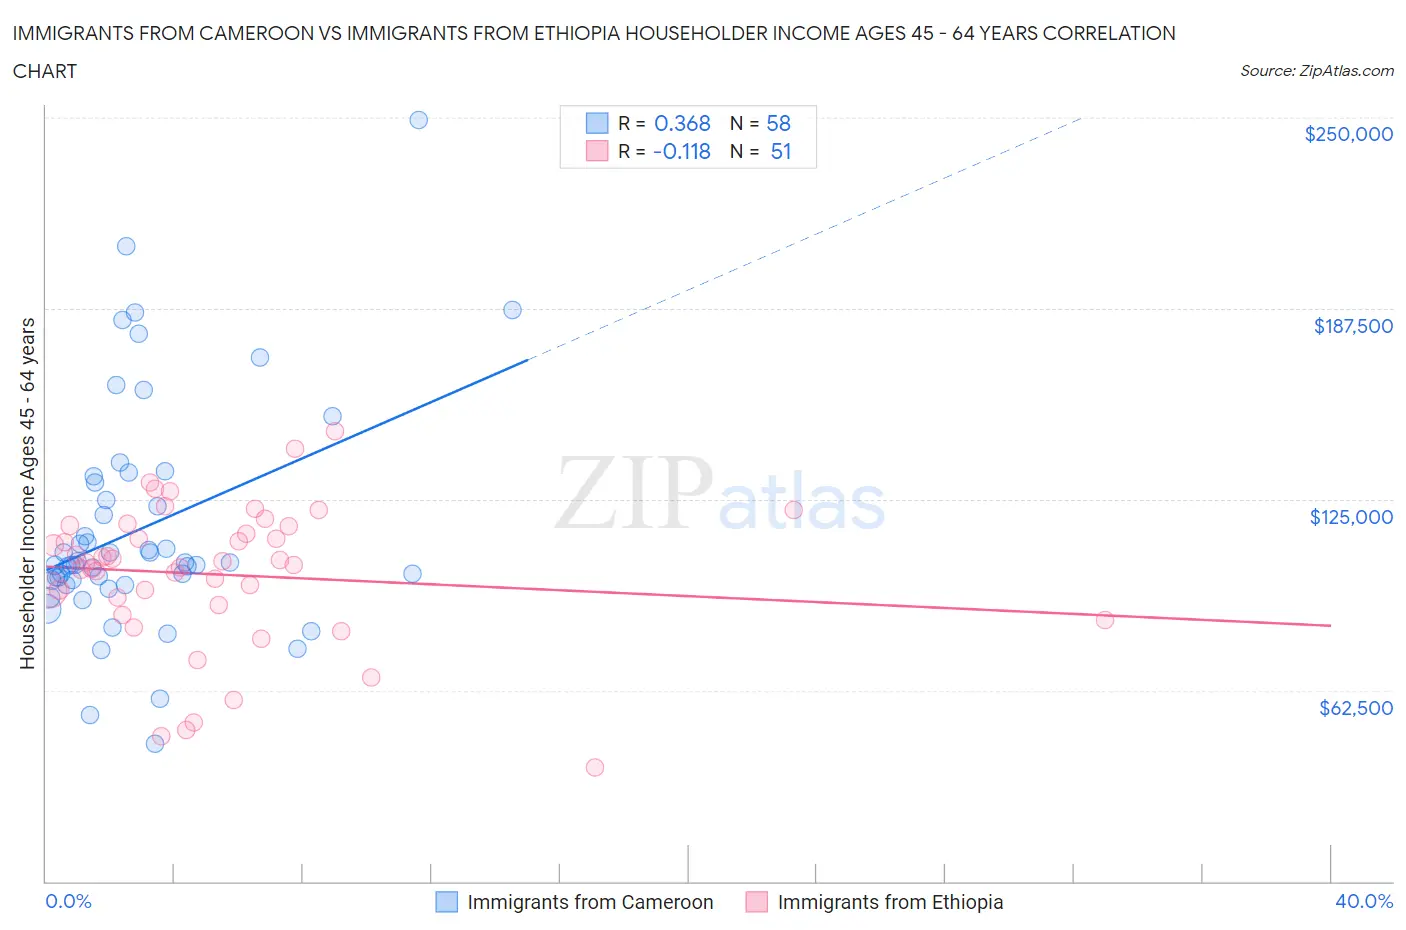
Immigrants from Cameroon vs Immigrants from Ethiopia Householder Income Ages 45 - 64 years Correlation Chart

The statistical analysis conducted on geographies consisting of 130,699,508 people shows a mild positive correlation between the proportion of Immigrants from Cameroon and household income with householder between the ages 45 and 64 in the United States with a correlation coefficient (R) of 0.368 and weighted average of $100,084. Similarly, the statistical analysis conducted on geographies consisting of 211,332,039 people shows a poor negative correlation between the proportion of Immigrants from Ethiopia and household income with householder between the ages 45 and 64 in the United States with a correlation coefficient (R) of -0.118 and weighted average of $102,763, a difference of 2.7%.
Immigrants from Cameroon vs Immigrants from Ethiopia Householder Income Ages 45 - 64 years

Householder Income Ages 45 - 64 years Correlation Summary

MeasurementImmigrants from CameroonImmigrants from Ethiopia
Minimum$45,128$37,206
Maximum$249,250$147,240
Range$204,122$110,034
Mean$115,608$100,387
Median$104,009$104,236
Interquartile 25% (IQ1)$98,639$90,455
Interquartile 75% (IQ3)$130,520$116,400
Interquartile Range (IQR)$31,881$25,945
Standard Deviation (Sample)$37,628$23,411
Standard Deviation (Population)$37,302$23,180

Similar Demographics by Householder Income Ages 45 - 64 years

Demographics Similar to Immigrants from Cameroon by Householder Income Ages 45 - 64 years

In terms of householder income ages 45 - 64 years, the demographic groups most similar to Immigrants from Cameroon are Belgian ($100,060, a difference of 0.020%), Aleut ($100,052, a difference of 0.030%), Moroccan ($100,138, a difference of 0.050%), Immigrants from Costa Rica ($100,141, a difference of 0.060%), and German ($100,224, a difference of 0.14%).
DemographicsRating | RankHouseholder Income Ages 45 - 64 years
South Americans
56.4
/100
|
#171
Average
$100,837
Immigrants | Uzbekistan
52.5
/100
|
#172
Average
$100,523
Alsatians
51.4
/100
|
#173
Average
$100,435
Welsh
50.0
/100
|
#174
Average
$100,322
Germans
48.8
/100
|
#175
Average
$100,224
Immigrants | Costa Rica
47.7
/100
|
#176
Average
$100,141
Moroccans
47.7
/100
|
#177
Average
$100,138
Immigrants | Cameroon
47.0
/100
|
#178
Average
$100,084
Belgians
46.7
/100
|
#179
Average
$100,060
Aleuts
46.6
/100
|
#180
Average
$100,052
Immigrants | Immigrants
45.3
/100
|
#181
Average
$99,943
Finns
44.8
/100
|
#182
Average
$99,904
Spaniards
44.6
/100
|
#183
Average
$99,889
French
43.8
/100
|
#184
Average
$99,824
Colombians
43.2
/100
|
#185
Average
$99,772

Demographics Similar to Immigrants from Ethiopia by Householder Income Ages 45 - 64 years

In terms of householder income ages 45 - 64 years, the demographic groups most similar to Immigrants from Ethiopia are Carpatho Rusyn ($102,777, a difference of 0.010%), Costa Rican ($102,779, a difference of 0.020%), Slovene ($102,885, a difference of 0.12%), Slavic ($102,629, a difference of 0.13%), and Scandinavian ($102,969, a difference of 0.20%).
DemographicsRating | RankHouseholder Income Ages 45 - 64 years
Immigrants | Peru
80.7
/100
|
#150
Excellent
$103,173
Swiss
79.9
/100
|
#151
Good
$103,071
Irish
79.8
/100
|
#152
Good
$103,067
Scandinavians
79.0
/100
|
#153
Good
$102,969
Slovenes
78.3
/100
|
#154
Good
$102,885
Costa Ricans
77.4
/100
|
#155
Good
$102,779
Carpatho Rusyns
77.4
/100
|
#156
Good
$102,777
Immigrants | Ethiopia
77.3
/100
|
#157
Good
$102,763
Slavs
76.1
/100
|
#158
Good
$102,629
Sierra Leoneans
74.2
/100
|
#159
Good
$102,427
Icelanders
72.5
/100
|
#160
Good
$102,261
Immigrants | Nepal
71.8
/100
|
#161
Good
$102,190
Scottish
71.1
/100
|
#162
Good
$102,123
English
70.1
/100
|
#163
Good
$102,021
Immigrants | Morocco
70.0
/100
|
#164
Good
$102,015