Immigrants from Cambodia vs Honduran Householder Income Ages 45 - 64 years
COMPARE
Immigrants from Cambodia
Honduran
Householder Income Ages 45 - 64 years
Householder Income Ages 45 - 64 years Comparison
Immigrants from Cambodia
Hondurans
$96,537
HOUSEHOLDER INCOME AGES 45 - 64 YEARS
13.0/ 100
METRIC RATING
211th/ 347
METRIC RANK
$84,079
HOUSEHOLDER INCOME AGES 45 - 64 YEARS
0.0/ 100
METRIC RATING
303rd/ 347
METRIC RANK
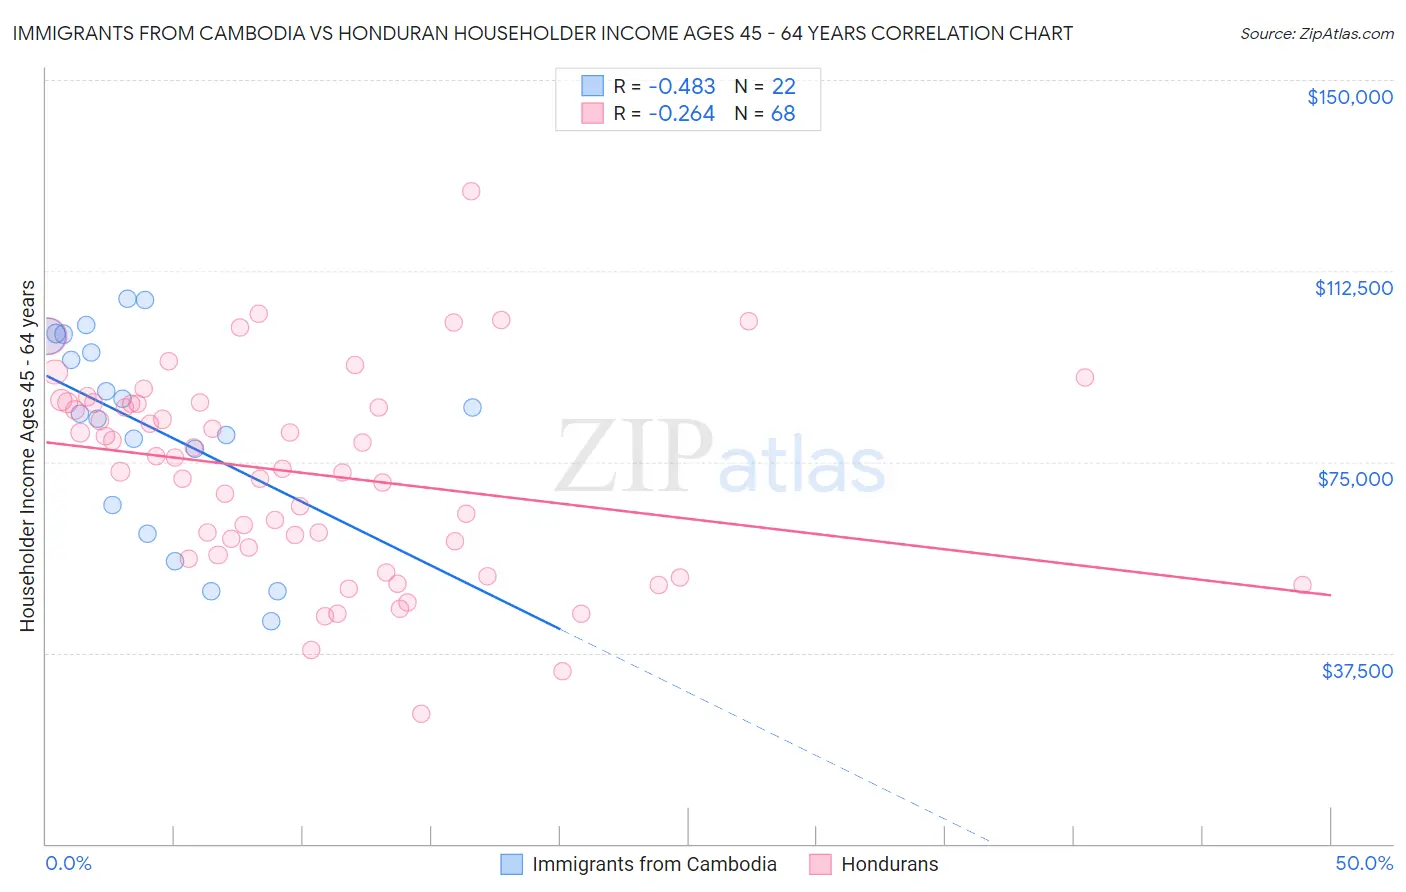
Immigrants from Cambodia vs Honduran Householder Income Ages 45 - 64 years Correlation Chart
The statistical analysis conducted on geographies consisting of 205,043,738 people shows a moderate negative correlation between the proportion of Immigrants from Cambodia and household income with householder between the ages 45 and 64 in the United States with a correlation coefficient (R) of -0.483 and weighted average of $96,537. Similarly, the statistical analysis conducted on geographies consisting of 357,242,150 people shows a weak negative correlation between the proportion of Hondurans and household income with householder between the ages 45 and 64 in the United States with a correlation coefficient (R) of -0.264 and weighted average of $84,079, a difference of 14.8%.
Householder Income Ages 45 - 64 years Correlation Summary
| Measurement | Immigrants from Cambodia | Honduran |
| Minimum | $43,614 | $25,625 |
| Maximum | $107,055 | $128,207 |
| Range | $63,441 | $102,582 |
| Mean | $81,812 | $72,746 |
| Median | $85,046 | $74,692 |
| Interquartile 25% (IQ1) | $66,651 | $57,383 |
| Interquartile 75% (IQ3) | $99,554 | $86,481 |
| Interquartile Range (IQR) | $32,903 | $29,098 |
| Standard Deviation (Sample) | $19,590 | $19,858 |
| Standard Deviation (Population) | $19,140 | $19,711 |
Similar Demographics by Householder Income Ages 45 - 64 years
Demographics Similar to Immigrants from Cambodia by Householder Income Ages 45 - 64 years
In terms of householder income ages 45 - 64 years, the demographic groups most similar to Immigrants from Cambodia are Venezuelan ($96,460, a difference of 0.080%), Tsimshian ($96,783, a difference of 0.26%), Japanese ($96,834, a difference of 0.31%), Immigrants from Uruguay ($96,086, a difference of 0.47%), and Panamanian ($96,066, a difference of 0.49%).
| Demographics | Rating | Rank | Householder Income Ages 45 - 64 years |
| Immigrants | Eritrea | 18.6 /100 | #204 | Poor $97,373 |
| Immigrants | Colombia | 18.0 /100 | #205 | Poor $97,290 |
| Immigrants | Africa | 17.9 /100 | #206 | Poor $97,284 |
| Ghanaians | 17.9 /100 | #207 | Poor $97,277 |
| Scotch-Irish | 16.4 /100 | #208 | Poor $97,073 |
| Japanese | 14.8 /100 | #209 | Poor $96,834 |
| Tsimshian | 14.5 /100 | #210 | Poor $96,783 |
| Immigrants | Cambodia | 13.0 /100 | #211 | Poor $96,537 |
| Venezuelans | 12.6 /100 | #212 | Poor $96,460 |
| Immigrants | Uruguay | 10.7 /100 | #213 | Poor $96,086 |
| Panamanians | 10.6 /100 | #214 | Poor $96,066 |
| Nigerians | 8.2 /100 | #215 | Tragic $95,492 |
| Immigrants | Venezuela | 7.6 /100 | #216 | Tragic $95,342 |
| Immigrants | Ghana | 6.4 /100 | #217 | Tragic $94,982 |
| Delaware | 6.2 /100 | #218 | Tragic $94,914 |
Demographics Similar to Hondurans by Householder Income Ages 45 - 64 years
In terms of householder income ages 45 - 64 years, the demographic groups most similar to Hondurans are Ottawa ($83,953, a difference of 0.15%), Chippewa ($83,943, a difference of 0.16%), Ute ($83,937, a difference of 0.17%), Haitian ($84,384, a difference of 0.36%), and Shoshone ($83,588, a difference of 0.59%).
| Demographics | Rating | Rank | Householder Income Ages 45 - 64 years |
| Immigrants | Zaire | 0.1 /100 | #296 | Tragic $85,207 |
| Fijians | 0.1 /100 | #297 | Tragic $85,187 |
| Africans | 0.0 /100 | #298 | Tragic $84,925 |
| Immigrants | Mexico | 0.0 /100 | #299 | Tragic $84,910 |
| Indonesians | 0.0 /100 | #300 | Tragic $84,890 |
| Potawatomi | 0.0 /100 | #301 | Tragic $84,613 |
| Haitians | 0.0 /100 | #302 | Tragic $84,384 |
| Hondurans | 0.0 /100 | #303 | Tragic $84,079 |
| Ottawa | 0.0 /100 | #304 | Tragic $83,953 |
| Chippewa | 0.0 /100 | #305 | Tragic $83,943 |
| Ute | 0.0 /100 | #306 | Tragic $83,937 |
| Shoshone | 0.0 /100 | #307 | Tragic $83,588 |
| Immigrants | Cabo Verde | 0.0 /100 | #308 | Tragic $83,542 |
| Immigrants | Dominica | 0.0 /100 | #309 | Tragic $83,311 |
| Immigrants | Haiti | 0.0 /100 | #310 | Tragic $83,257 |