Immigrants from Brazil vs French Median Male Earnings
COMPARE
Immigrants from Brazil
French
Median Male Earnings
Median Male Earnings Comparison
Immigrants from Brazil
French
$58,324
MEDIAN MALE EARNINGS
97.7/ 100
METRIC RATING
101st/ 347
METRIC RANK
$55,350
MEDIAN MALE EARNINGS
69.9/ 100
METRIC RATING
162nd/ 347
METRIC RANK
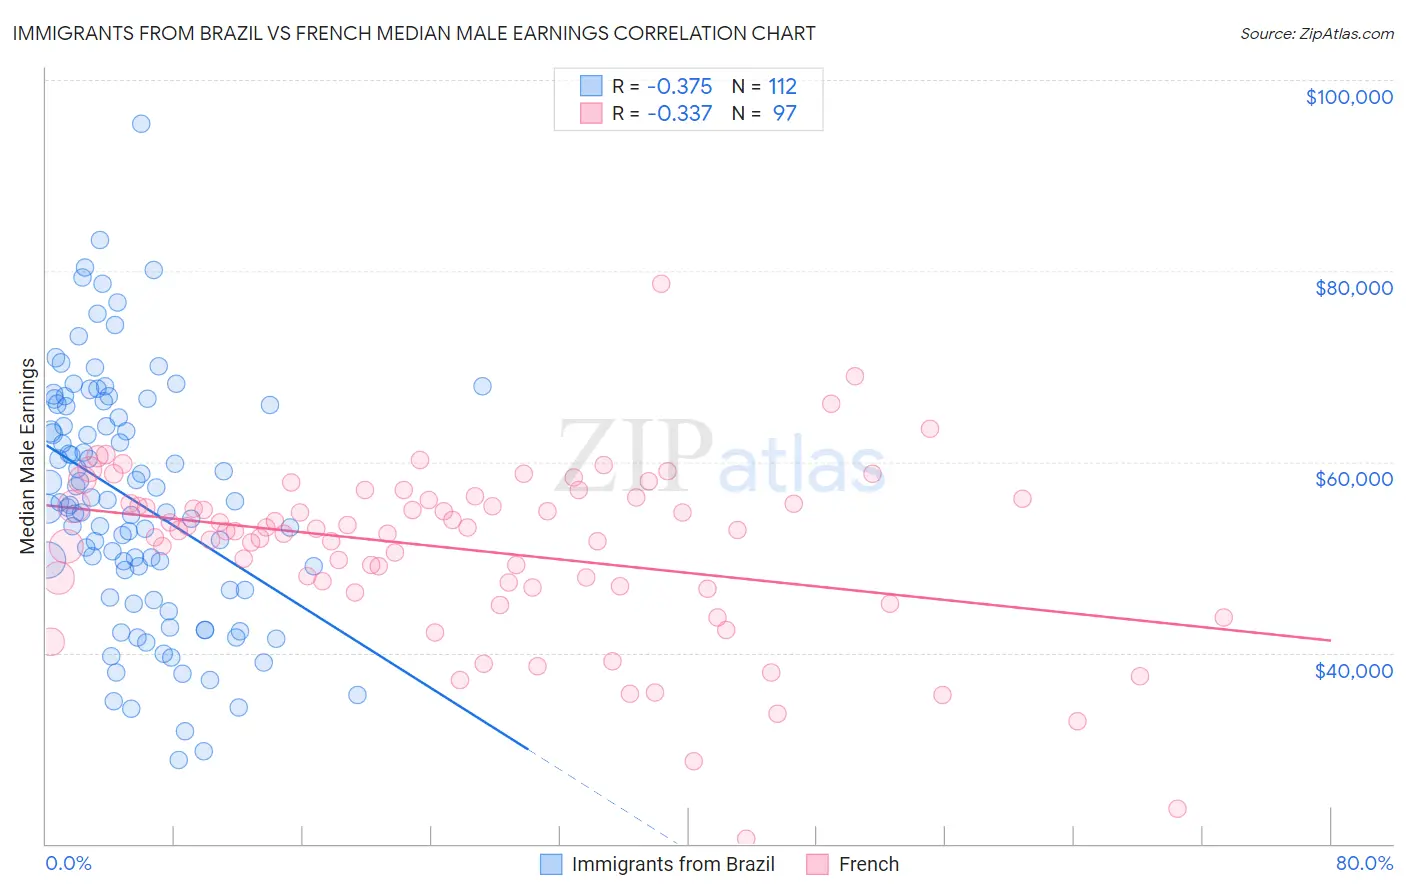
Immigrants from Brazil vs French Median Male Earnings Correlation Chart
The statistical analysis conducted on geographies consisting of 342,925,188 people shows a mild negative correlation between the proportion of Immigrants from Brazil and median male earnings in the United States with a correlation coefficient (R) of -0.375 and weighted average of $58,324. Similarly, the statistical analysis conducted on geographies consisting of 571,095,815 people shows a mild negative correlation between the proportion of French and median male earnings in the United States with a correlation coefficient (R) of -0.337 and weighted average of $55,350, a difference of 5.4%.
Median Male Earnings Correlation Summary
| Measurement | Immigrants from Brazil | French |
| Minimum | $28,750 | $20,556 |
| Maximum | $95,391 | $78,663 |
| Range | $66,641 | $58,107 |
| Mean | $55,921 | $50,816 |
| Median | $55,594 | $52,806 |
| Interquartile 25% (IQ1) | $46,610 | $46,933 |
| Interquartile 75% (IQ3) | $65,884 | $56,096 |
| Interquartile Range (IQR) | $19,274 | $9,162 |
| Standard Deviation (Sample) | $12,788 | $9,122 |
| Standard Deviation (Population) | $12,730 | $9,075 |
Similar Demographics by Median Male Earnings
Demographics Similar to Immigrants from Brazil by Median Male Earnings
In terms of median male earnings, the demographic groups most similar to Immigrants from Brazil are Assyrian/Chaldean/Syriac ($58,437, a difference of 0.19%), Immigrants from Poland ($58,452, a difference of 0.22%), Syrian ($58,187, a difference of 0.24%), Jordanian ($58,500, a difference of 0.30%), and Polish ($58,139, a difference of 0.32%).
| Demographics | Rating | Rank | Median Male Earnings |
| Immigrants | North Macedonia | 99.0 /100 | #94 | Exceptional $59,189 |
| Immigrants | Lebanon | 98.6 /100 | #95 | Exceptional $58,835 |
| Albanians | 98.4 /100 | #96 | Exceptional $58,680 |
| Northern Europeans | 98.2 /100 | #97 | Exceptional $58,588 |
| Jordanians | 98.1 /100 | #98 | Exceptional $58,500 |
| Immigrants | Poland | 98.0 /100 | #99 | Exceptional $58,452 |
| Assyrians/Chaldeans/Syriacs | 97.9 /100 | #100 | Exceptional $58,437 |
| Immigrants | Brazil | 97.7 /100 | #101 | Exceptional $58,324 |
| Syrians | 97.4 /100 | #102 | Exceptional $58,187 |
| Poles | 97.3 /100 | #103 | Exceptional $58,139 |
| Armenians | 97.3 /100 | #104 | Exceptional $58,134 |
| Immigrants | Western Asia | 97.3 /100 | #105 | Exceptional $58,131 |
| Immigrants | Northern Africa | 96.9 /100 | #106 | Exceptional $58,008 |
| Serbians | 96.8 /100 | #107 | Exceptional $57,975 |
| Immigrants | Uzbekistan | 96.7 /100 | #108 | Exceptional $57,941 |
Demographics Similar to French by Median Male Earnings
In terms of median male earnings, the demographic groups most similar to French are Belgian ($55,361, a difference of 0.020%), Basque ($55,370, a difference of 0.040%), Alsatian ($55,380, a difference of 0.050%), Czechoslovakian ($55,382, a difference of 0.060%), and Ugandan ($55,290, a difference of 0.11%).
| Demographics | Rating | Rank | Median Male Earnings |
| Scandinavians | 73.4 /100 | #155 | Good $55,527 |
| Immigrants | Ethiopia | 71.6 /100 | #156 | Good $55,434 |
| Icelanders | 71.2 /100 | #157 | Good $55,415 |
| Czechoslovakians | 70.5 /100 | #158 | Good $55,382 |
| Alsatians | 70.5 /100 | #159 | Good $55,380 |
| Basques | 70.3 /100 | #160 | Good $55,370 |
| Belgians | 70.1 /100 | #161 | Good $55,361 |
| French | 69.9 /100 | #162 | Good $55,350 |
| Ugandans | 68.6 /100 | #163 | Good $55,290 |
| Immigrants | South Eastern Asia | 67.6 /100 | #164 | Good $55,241 |
| Immigrants | Portugal | 66.3 /100 | #165 | Good $55,182 |
| Germans | 61.6 /100 | #166 | Good $54,974 |
| Immigrants | Fiji | 61.2 /100 | #167 | Good $54,958 |
| Immigrants | Vietnam | 60.2 /100 | #168 | Good $54,913 |
| French Canadians | 55.6 /100 | #169 | Average $54,722 |