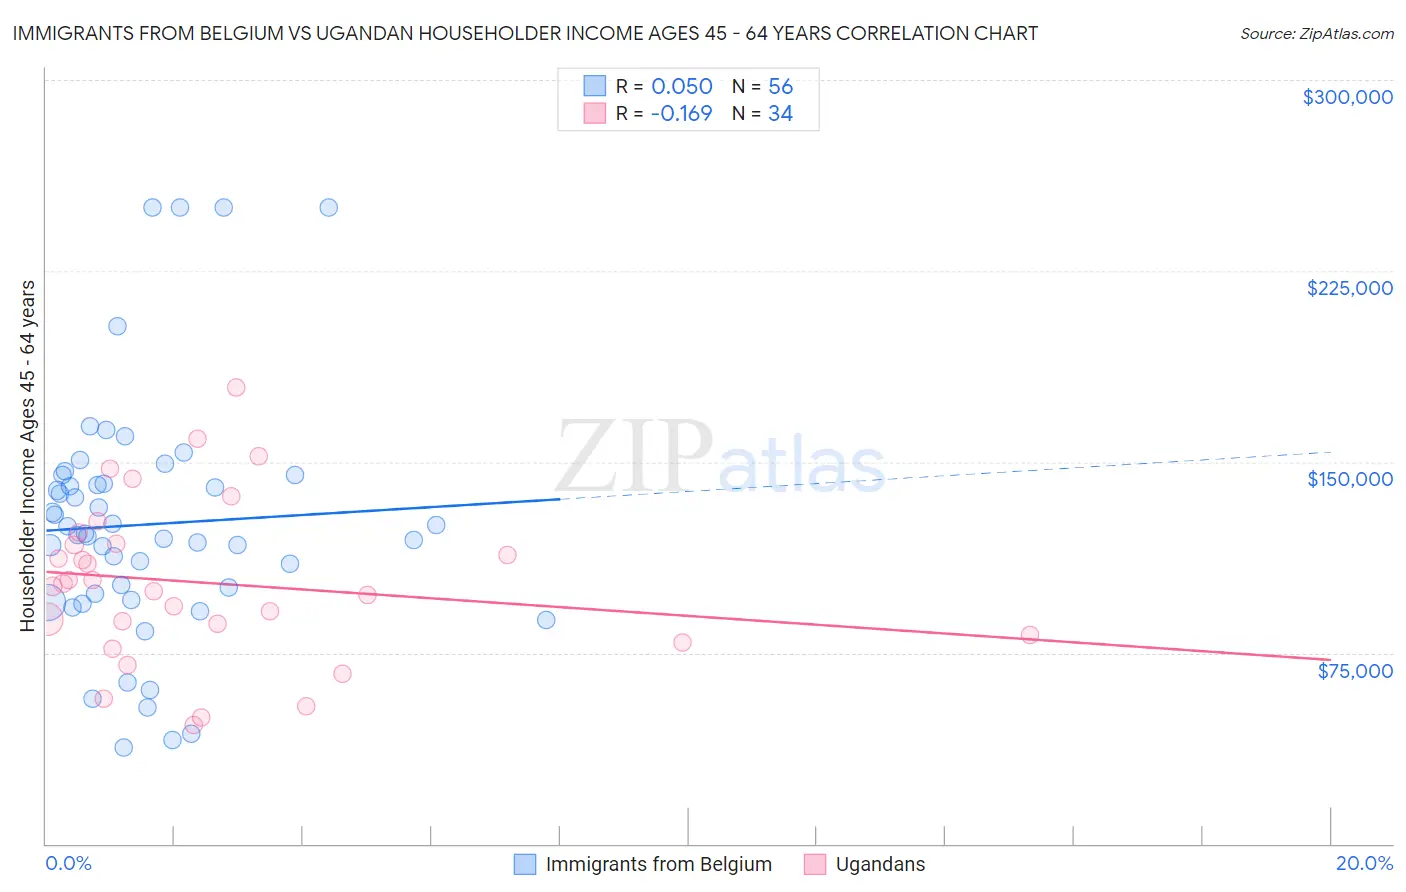
Immigrants from Belgium vs Ugandan Householder Income Ages 45 - 64 years
COMPARE
Immigrants from Belgium
Ugandan
Householder Income Ages 45 - 64 years
Householder Income Ages 45 - 64 years Comparison
Immigrants from Belgium
Ugandans
$118,932
HOUSEHOLDER INCOME AGES 45 - 64 YEARS
100.0/ 100
METRIC RATING
22nd/ 347
METRIC RANK
$103,472
HOUSEHOLDER INCOME AGES 45 - 64 YEARS
82.9/ 100
METRIC RATING
145th/ 347
METRIC RANK
Immigrants from Belgium vs Ugandan Householder Income Ages 45 - 64 years Correlation Chart
The statistical analysis conducted on geographies consisting of 146,611,057 people shows a slight positive correlation between the proportion of Immigrants from Belgium and household income with householder between the ages 45 and 64 in the United States with a correlation coefficient (R) of 0.050 and weighted average of $118,932. Similarly, the statistical analysis conducted on geographies consisting of 93,977,582 people shows a poor negative correlation between the proportion of Ugandans and household income with householder between the ages 45 and 64 in the United States with a correlation coefficient (R) of -0.169 and weighted average of $103,472, a difference of 14.9%.
Householder Income Ages 45 - 64 years Correlation Summary
| Measurement | Immigrants from Belgium | Ugandan |
| Minimum | $38,026 | $46,767 |
| Maximum | $250,001 | $179,310 |
| Range | $211,975 | $132,543 |
| Mean | $125,440 | $102,498 |
| Median | $121,589 | $101,686 |
| Interquartile 25% (IQ1) | $96,886 | $82,188 |
| Interquartile 75% (IQ3) | $142,973 | $117,857 |
| Interquartile Range (IQR) | $46,087 | $35,669 |
| Standard Deviation (Sample) | $48,145 | $31,832 |
| Standard Deviation (Population) | $47,713 | $31,360 |
Similar Demographics by Householder Income Ages 45 - 64 years
Demographics Similar to Immigrants from Belgium by Householder Income Ages 45 - 64 years
In terms of householder income ages 45 - 64 years, the demographic groups most similar to Immigrants from Belgium are Bolivian ($118,871, a difference of 0.050%), Immigrants from Sri Lanka ($119,094, a difference of 0.14%), Immigrants from Australia ($119,308, a difference of 0.32%), Immigrants from Japan ($118,498, a difference of 0.37%), and Asian ($118,426, a difference of 0.43%).
| Demographics | Rating | Rank | Householder Income Ages 45 - 64 years |
| Immigrants | Eastern Asia | 100.0 /100 | #15 | Exceptional $122,222 |
| Immigrants | China | 100.0 /100 | #16 | Exceptional $122,178 |
| Burmese | 100.0 /100 | #17 | Exceptional $121,444 |
| Immigrants | Korea | 100.0 /100 | #18 | Exceptional $121,243 |
| Eastern Europeans | 100.0 /100 | #19 | Exceptional $120,684 |
| Immigrants | Australia | 100.0 /100 | #20 | Exceptional $119,308 |
| Immigrants | Sri Lanka | 100.0 /100 | #21 | Exceptional $119,094 |
| Immigrants | Belgium | 100.0 /100 | #22 | Exceptional $118,932 |
| Bolivians | 100.0 /100 | #23 | Exceptional $118,871 |
| Immigrants | Japan | 100.0 /100 | #24 | Exceptional $118,498 |
| Asians | 100.0 /100 | #25 | Exceptional $118,426 |
| Immigrants | Sweden | 100.0 /100 | #26 | Exceptional $118,318 |
| Immigrants | Northern Europe | 100.0 /100 | #27 | Exceptional $117,930 |
| Turks | 100.0 /100 | #28 | Exceptional $117,814 |
| Bhutanese | 100.0 /100 | #29 | Exceptional $117,750 |
Demographics Similar to Ugandans by Householder Income Ages 45 - 64 years
In terms of householder income ages 45 - 64 years, the demographic groups most similar to Ugandans are Czech ($103,507, a difference of 0.030%), Serbian ($103,522, a difference of 0.050%), Luxembourger ($103,536, a difference of 0.060%), Immigrants from Chile ($103,412, a difference of 0.060%), and Basque ($103,387, a difference of 0.080%).
| Demographics | Rating | Rank | Householder Income Ages 45 - 64 years |
| Ethiopians | 84.7 /100 | #138 | Excellent $103,736 |
| Immigrants | Oceania | 84.5 /100 | #139 | Excellent $103,705 |
| Norwegians | 84.3 /100 | #140 | Excellent $103,682 |
| Immigrants | Uganda | 83.7 /100 | #141 | Excellent $103,584 |
| Luxembourgers | 83.3 /100 | #142 | Excellent $103,536 |
| Serbians | 83.2 /100 | #143 | Excellent $103,522 |
| Czechs | 83.1 /100 | #144 | Excellent $103,507 |
| Ugandans | 82.9 /100 | #145 | Excellent $103,472 |
| Immigrants | Chile | 82.5 /100 | #146 | Excellent $103,412 |
| Basques | 82.3 /100 | #147 | Excellent $103,387 |
| Immigrants | Germany | 81.5 /100 | #148 | Excellent $103,282 |
| Immigrants | Sierra Leone | 81.1 /100 | #149 | Excellent $103,227 |
| Immigrants | Peru | 80.7 /100 | #150 | Excellent $103,173 |
| Swiss | 79.9 /100 | #151 | Good $103,071 |
| Irish | 79.8 /100 | #152 | Good $103,067 |