Immigrants from Bangladesh vs Immigrants from Haiti Householder Income Ages 25 - 44 years

COMPARE

Immigrants from Bangladesh
Race
Ancestry
AfghanAfricanAlaska NativeAlaskan AthabascanAlbanianAleutAlsatianAmericanApacheArabArapahoArgentineanArmenianAssyrian/Chaldean/SyriacAustralianAustrianBahamianBangladeshiBarbadianBasqueBelgianBelizeanBermudanBhutaneseBlackfeetBolivianBrazilianBritishBritish West IndianBulgarianBurmeseCajunCambodianCanadianCape VerdeanCarpatho RusynCelticCentral AmericanCentral American IndianCherokeeCheyenneChickasawChileanChineseChippewaChoctawColombianColvilleComancheCosta RicanCreeCreekCroatianCrowCubanCypriotCzechCzechoslovakianDanishDelawareDominicanDutchDutch West IndianEastern EuropeanEcuadorianEgyptianEnglishEstonianEthiopianEuropeanFijianFilipinoFinnishFrenchFrench American IndianFrench CanadianGermanGerman RussianGhanaianGreekGuamanian/ChamorroGuatemalanGuyaneseHaitianHmongHonduranHopiHoumaHungarianIcelanderIndian (Asian)IndonesianInupiatIranianIraqiIrishIroquoisIsraeliItalianJamaicanJapaneseJordanianKenyanKiowaKoreanLaotianLatvianLebaneseLiberianLithuanianLumbeeLuxembourgerMacedonianMalaysianMalteseMarshalleseMenomineeMexicanMexican American IndianMongolianMoroccanNative HawaiianNavajoNepaleseNew ZealanderNicaraguanNigerianNorthern EuropeanNorwegianOkinawanOsageOttawaPaiutePakistaniPalestinianPanamanianParaguayanPennsylvania GermanPeruvianPimaPolishPortuguesePotawatomiPuebloPuerto RicanPuget Sound SalishRomanianRussianSalvadoranSamoanScandinavianScotch-IrishScottishSeminoleSenegaleseSerbianShoshoneSierra LeoneanSiouxSlavicSlovakSloveneSomaliSouth AfricanSouth AmericanSouth American IndianSoviet UnionSpaniardSpanishSpanish AmericanSpanish American IndianSri LankanSubsaharan AfricanSudaneseSwedishSwissSyrianTaiwaneseThaiTlingit-HaidaTohono O'OdhamTonganTrinidadian and TobagonianTsimshianTurkishU.S. Virgin IslanderUgandanUkrainianUruguayanUteVenezuelanVietnameseWelshWest IndianYakamaYaquiYugoslavianYumanYup'ikZimbabwean
Immigration
NonimmigrantsImmigrantsAfghanistanAfricaAlbaniaArgentinaArmeniaAsiaAustraliaAustriaBahamasBangladeshBarbadosBelarusBelgiumBelizeBoliviaBosnia and HerzegovinaBrazilBulgariaBurma/MyanmarCabo VerdeCambodiaCameroonCanadaCaribbeanCentral AmericaChileChinaColombiaCongoCosta RicaCroatiaCubaCzechoslovakiaDenmarkDominicaDominican RepublicEastern AfricaEastern AsiaEastern EuropeEcuadorEgyptEl SalvadorEnglandEritreaEthiopiaEuropeFijiFranceGermanyGhanaGreeceGrenadaGuatemalaGuyanaHondurasHong KongHungaryIndiaIndonesiaIranIraqIrelandIsraelItalyJamaicaJapanJordanKazakhstanKenyaKoreaKuwaitLaosLatin AmericaLatviaLebanonLiberiaLithuaniaMalaysiaMexicoMicronesiaMiddle AfricaMoldovaMoroccoNepalNetherlandsNicaraguaNigeriaNorth AmericaNorth MacedoniaNorthern AfricaNorthern EuropeNorwayOceaniaPakistanPanamaPeruPhilippinesPolandPortugalRomaniaRussiaSaudi ArabiaScotlandSenegalSerbiaSierra LeoneSingaporeSomaliaSouth AfricaSouth AmericaSouth Central AsiaSouth Eastern AsiaSouthern EuropeSpainSri LankaSt. Vincent and the GrenadinesSudanSwedenSwitzerlandSyriaTaiwanThailandTrinidad and TobagoTurkeyUgandaUkraineUruguayUzbekistanVenezuelaVietnamWest IndiesWestern AfricaWestern AsiaWestern EuropeYemenZaireZimbabweAzores
Immigrants from Haiti
Race
Ancestry
AfghanAfricanAlaska NativeAlaskan AthabascanAlbanianAleutAlsatianAmericanApacheArabArapahoArgentineanArmenianAssyrian/Chaldean/SyriacAustralianAustrianBahamianBangladeshiBarbadianBasqueBelgianBelizeanBermudanBhutaneseBlackfeetBolivianBrazilianBritishBritish West IndianBulgarianBurmeseCajunCambodianCanadianCape VerdeanCarpatho RusynCelticCentral AmericanCentral American IndianCherokeeCheyenneChickasawChileanChineseChippewaChoctawColombianColvilleComancheCosta RicanCreeCreekCroatianCrowCubanCypriotCzechCzechoslovakianDanishDelawareDominicanDutchDutch West IndianEastern EuropeanEcuadorianEgyptianEnglishEstonianEthiopianEuropeanFijianFilipinoFinnishFrenchFrench American IndianFrench CanadianGermanGerman RussianGhanaianGreekGuamanian/ChamorroGuatemalanGuyaneseHaitianHmongHonduranHopiHoumaHungarianIcelanderIndian (Asian)IndonesianInupiatIranianIraqiIrishIroquoisIsraeliItalianJamaicanJapaneseJordanianKenyanKiowaKoreanLaotianLatvianLebaneseLiberianLithuanianLumbeeLuxembourgerMacedonianMalaysianMalteseMarshalleseMenomineeMexicanMexican American IndianMongolianMoroccanNative HawaiianNavajoNepaleseNew ZealanderNicaraguanNigerianNorthern EuropeanNorwegianOkinawanOsageOttawaPaiutePakistaniPalestinianPanamanianParaguayanPennsylvania GermanPeruvianPimaPolishPortuguesePotawatomiPuebloPuerto RicanPuget Sound SalishRomanianRussianSalvadoranSamoanScandinavianScotch-IrishScottishSeminoleSenegaleseSerbianShoshoneSierra LeoneanSiouxSlavicSlovakSloveneSomaliSouth AfricanSouth AmericanSouth American IndianSoviet UnionSpaniardSpanishSpanish AmericanSpanish American IndianSri LankanSubsaharan AfricanSudaneseSwedishSwissSyrianTaiwaneseThaiTlingit-HaidaTohono O'OdhamTonganTrinidadian and TobagonianTsimshianTurkishU.S. Virgin IslanderUgandanUkrainianUruguayanUteVenezuelanVietnameseWelshWest IndianYakamaYaquiYugoslavianYumanYup'ikZimbabwean
Immigration
NonimmigrantsImmigrantsAfghanistanAfricaAlbaniaArgentinaArmeniaAsiaAustraliaAustriaBahamasBarbadosBelarusBelgiumBelizeBoliviaBosnia and HerzegovinaBrazilBulgariaBurma/MyanmarCabo VerdeCambodiaCameroonCanadaCaribbeanCentral AmericaChileChinaColombiaCongoCosta RicaCroatiaCubaCzechoslovakiaDenmarkDominicaDominican RepublicEastern AfricaEastern AsiaEastern EuropeEcuadorEgyptEl SalvadorEnglandEritreaEthiopiaEuropeFijiFranceGermanyGhanaGreeceGrenadaGuatemalaGuyanaHaitiHondurasHong KongHungaryIndiaIndonesiaIranIraqIrelandIsraelItalyJamaicaJapanJordanKazakhstanKenyaKoreaKuwaitLaosLatin AmericaLatviaLebanonLiberiaLithuaniaMalaysiaMexicoMicronesiaMiddle AfricaMoldovaMoroccoNepalNetherlandsNicaraguaNigeriaNorth AmericaNorth MacedoniaNorthern AfricaNorthern EuropeNorwayOceaniaPakistanPanamaPeruPhilippinesPolandPortugalRomaniaRussiaSaudi ArabiaScotlandSenegalSerbiaSierra LeoneSingaporeSomaliaSouth AfricaSouth AmericaSouth Central AsiaSouth Eastern AsiaSouthern EuropeSpainSri LankaSt. Vincent and the GrenadinesSudanSwedenSwitzerlandSyriaTaiwanThailandTrinidad and TobagoTurkeyUgandaUkraineUruguayUzbekistanVenezuelaVietnamWest IndiesWestern AfricaWestern AsiaWestern EuropeYemenZaireZimbabweAzores
Householder Income Ages 25 - 44 years
Income
Poverty
Unemployment
Labor Participation
Family Structure
Vehicle Availability
Education Level
Disability

Householder Income Ages 25 - 44 years Comparison

Immigrants from Bangladesh

Immigrants from Haiti

Tragic
Tragic
$90,448
HOUSEHOLDER INCOME AGES 25 - 44 YEARS
9.3/ 100
METRIC RATING
213th/ 347
METRIC RANK
$79,391
HOUSEHOLDER INCOME AGES 25 - 44 YEARS
0.0/ 100
METRIC RATING
312th/ 347
METRIC RANK

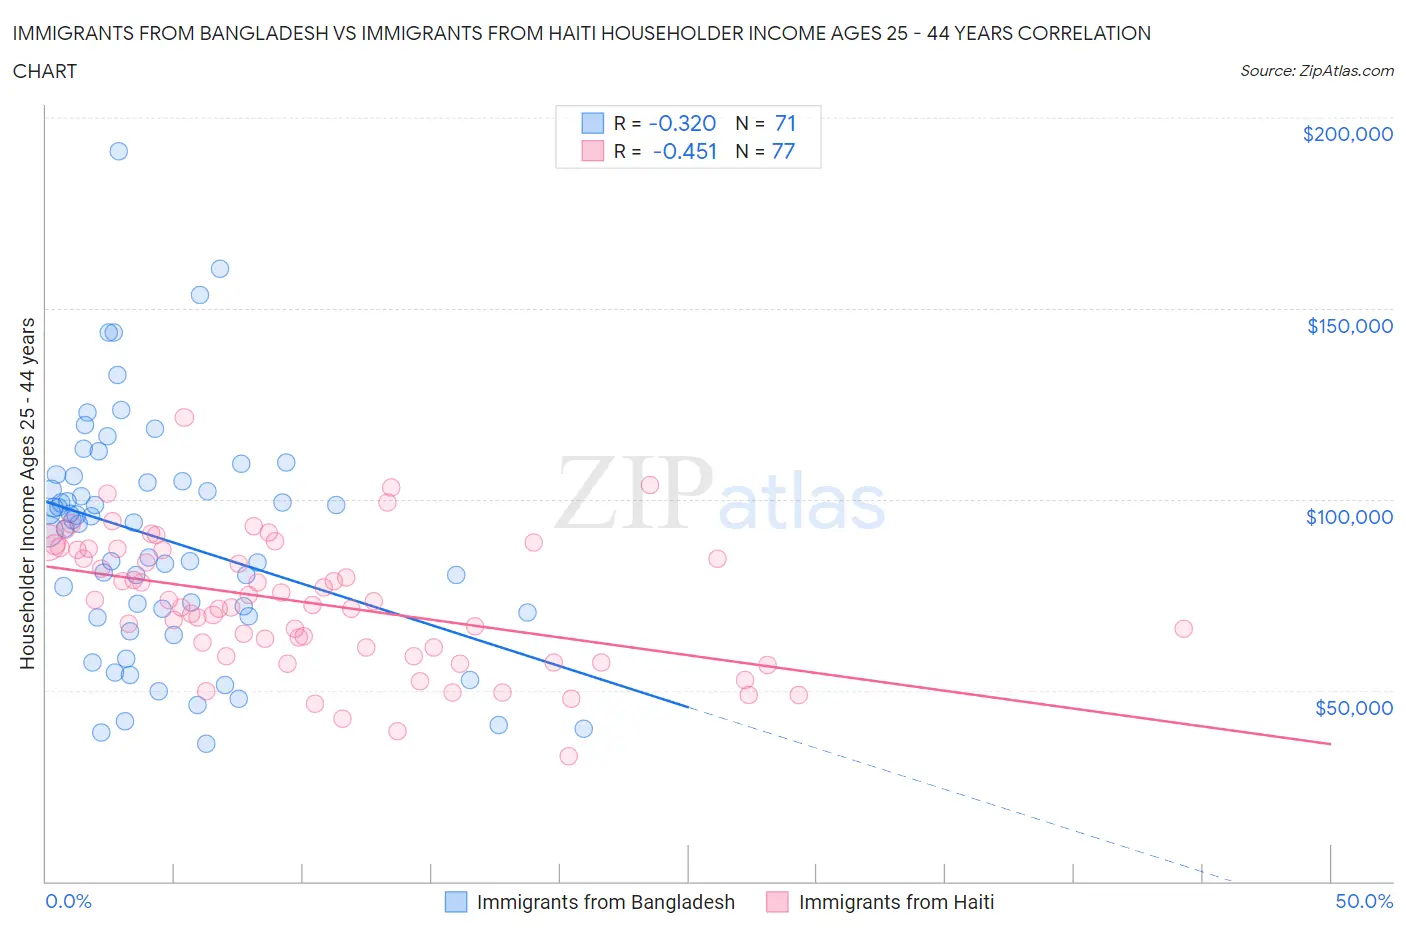
Immigrants from Bangladesh vs Immigrants from Haiti Householder Income Ages 25 - 44 years Correlation Chart

The statistical analysis conducted on geographies consisting of 203,449,247 people shows a mild negative correlation between the proportion of Immigrants from Bangladesh and household income with householder between the ages 25 and 44 in the United States with a correlation coefficient (R) of -0.320 and weighted average of $90,448. Similarly, the statistical analysis conducted on geographies consisting of 224,831,878 people shows a moderate negative correlation between the proportion of Immigrants from Haiti and household income with householder between the ages 25 and 44 in the United States with a correlation coefficient (R) of -0.451 and weighted average of $79,391, a difference of 13.9%.
Immigrants from Bangladesh vs Immigrants from Haiti Householder Income Ages 25 - 44 years

Householder Income Ages 25 - 44 years Correlation Summary

MeasurementImmigrants from BangladeshImmigrants from Haiti
Minimum$35,868$32,753
Maximum$191,104$121,599
Range$155,236$88,846
Mean$89,510$72,834
Median$93,714$72,419
Interquartile 25% (IQ1)$69,551$60,083
Interquartile 75% (IQ3)$104,853$86,997
Interquartile Range (IQR)$35,302$26,914
Standard Deviation (Sample)$30,547$17,154
Standard Deviation (Population)$30,331$17,042

Similar Demographics by Householder Income Ages 25 - 44 years

Demographics Similar to Immigrants from Bangladesh by Householder Income Ages 25 - 44 years

In terms of householder income ages 25 - 44 years, the demographic groups most similar to Immigrants from Bangladesh are Immigrants from Africa ($90,372, a difference of 0.090%), Panamanian ($90,193, a difference of 0.28%), Hawaiian ($90,722, a difference of 0.30%), Immigrants from Kenya ($90,767, a difference of 0.35%), and Iraqi ($90,764, a difference of 0.35%).
DemographicsRating | RankHouseholder Income Ages 25 - 44 years
Aleuts
14.5
/100
|
#206
Poor
$91,370
Yugoslavians
14.5
/100
|
#207
Poor
$91,368
Immigrants | Thailand
14.3
/100
|
#208
Poor
$91,337
Immigrants | Uruguay
13.2
/100
|
#209
Poor
$91,171
Immigrants | Kenya
10.9
/100
|
#210
Poor
$90,767
Iraqis
10.8
/100
|
#211
Poor
$90,764
Hawaiians
10.6
/100
|
#212
Poor
$90,722
Immigrants | Bangladesh
9.3
/100
|
#213
Tragic
$90,448
Immigrants | Africa
8.9
/100
|
#214
Tragic
$90,372
Panamanians
8.1
/100
|
#215
Tragic
$90,193
Ghanaians
7.9
/100
|
#216
Tragic
$90,137
Scotch-Irish
7.3
/100
|
#217
Tragic
$89,969
Guyanese
7.1
/100
|
#218
Tragic
$89,940
Delaware
6.9
/100
|
#219
Tragic
$89,876
Trinidadians and Tobagonians
6.8
/100
|
#220
Tragic
$89,856

Demographics Similar to Immigrants from Haiti by Householder Income Ages 25 - 44 years

In terms of householder income ages 25 - 44 years, the demographic groups most similar to Immigrants from Haiti are Menominee ($79,358, a difference of 0.040%), Indonesian ($79,543, a difference of 0.19%), Cheyenne ($79,152, a difference of 0.30%), Ottawa ($79,012, a difference of 0.48%), and African ($78,986, a difference of 0.51%).
DemographicsRating | RankHouseholder Income Ages 25 - 44 years
Immigrants | Dominican Republic
0.0
/100
|
#305
Tragic
$80,319
Apache
0.0
/100
|
#306
Tragic
$80,260
Haitians
0.0
/100
|
#307
Tragic
$80,055
Immigrants | Central America
0.0
/100
|
#308
Tragic
$80,012
Chippewa
0.0
/100
|
#309
Tragic
$80,005
Fijians
0.0
/100
|
#310
Tragic
$79,956
Indonesians
0.0
/100
|
#311
Tragic
$79,543
Immigrants | Haiti
0.0
/100
|
#312
Tragic
$79,391
Menominee
0.0
/100
|
#313
Tragic
$79,358
Cheyenne
0.0
/100
|
#314
Tragic
$79,152
Ottawa
0.0
/100
|
#315
Tragic
$79,012
Africans
0.0
/100
|
#316
Tragic
$78,986
U.S. Virgin Islanders
0.0
/100
|
#317
Tragic
$78,911
Immigrants | Mexico
0.0
/100
|
#318
Tragic
$78,809
Hondurans
0.0
/100
|
#319
Tragic
$78,540