Immigrants from the Azores vs Slovak Median Female Earnings
COMPARE
Immigrants from the Azores
Slovak
Median Female Earnings
Median Female Earnings Comparison
Immigrants from the Azores
Slovaks
$38,573
MEDIAN FEMALE EARNINGS
8.8/ 100
METRIC RATING
221st/ 347
METRIC RANK
$39,029
MEDIAN FEMALE EARNINGS
19.9/ 100
METRIC RATING
202nd/ 347
METRIC RANK
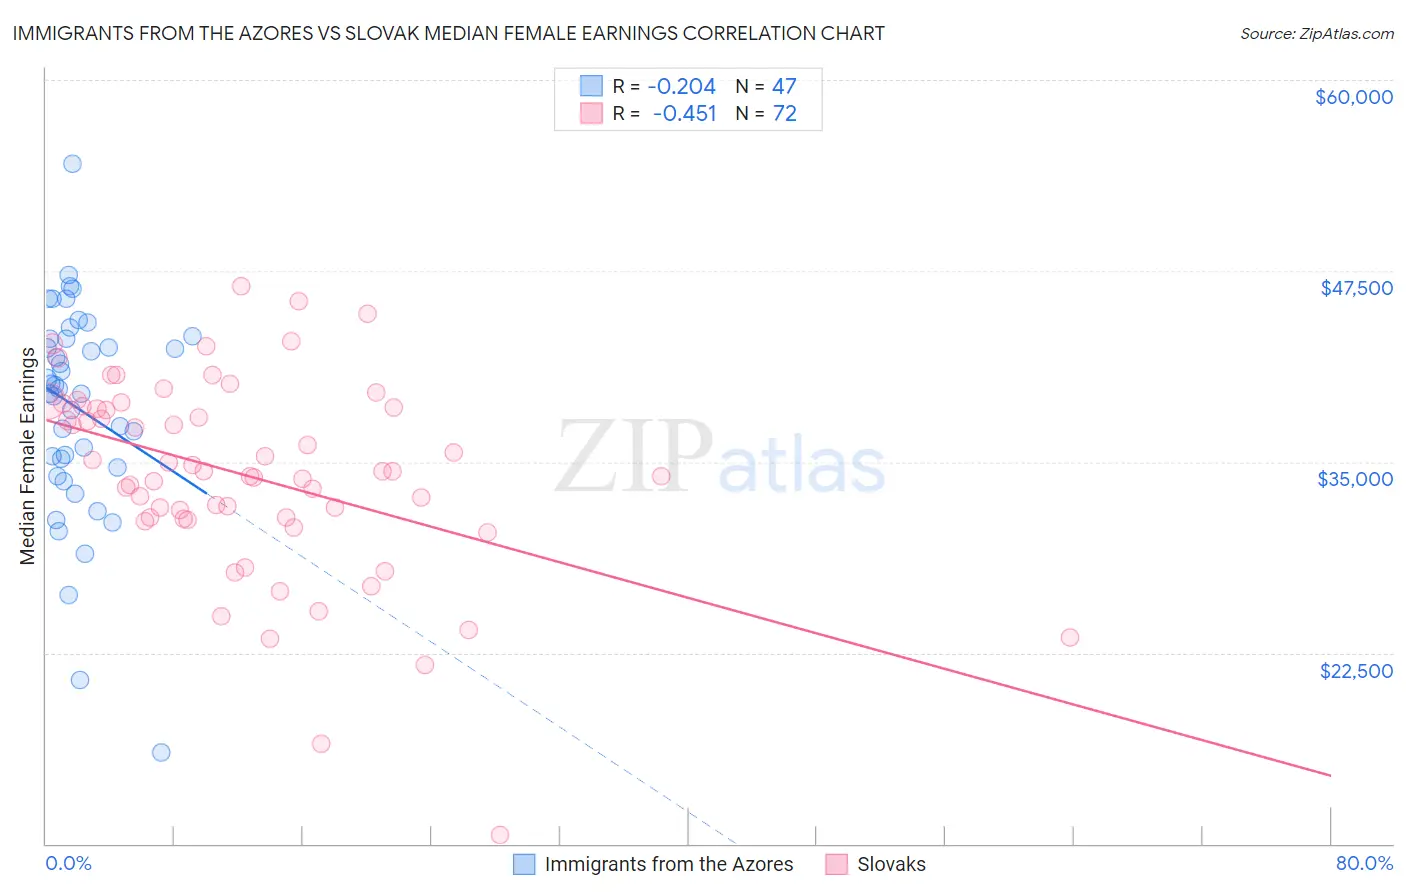
Immigrants from the Azores vs Slovak Median Female Earnings Correlation Chart
The statistical analysis conducted on geographies consisting of 46,252,710 people shows a weak negative correlation between the proportion of Immigrants from the Azores and median female earnings in the United States with a correlation coefficient (R) of -0.204 and weighted average of $38,573. Similarly, the statistical analysis conducted on geographies consisting of 397,593,925 people shows a moderate negative correlation between the proportion of Slovaks and median female earnings in the United States with a correlation coefficient (R) of -0.451 and weighted average of $39,029, a difference of 1.2%.
Median Female Earnings Correlation Summary
| Measurement | Immigrants from the Azores | Slovak |
| Minimum | $15,996 | $10,580 |
| Maximum | $54,521 | $46,470 |
| Range | $38,525 | $35,890 |
| Mean | $38,490 | $34,113 |
| Median | $39,828 | $34,365 |
| Interquartile 25% (IQ1) | $34,594 | $31,338 |
| Interquartile 75% (IQ3) | $43,084 | $38,606 |
| Interquartile Range (IQR) | $8,490 | $7,268 |
| Standard Deviation (Sample) | $7,045 | $6,495 |
| Standard Deviation (Population) | $6,970 | $6,450 |
Demographics Similar to Immigrants from the Azores and Slovaks by Median Female Earnings
In terms of median female earnings, the demographic groups most similar to Immigrants from the Azores are Yugoslavian ($38,573, a difference of 0.0%), Nepalese ($38,603, a difference of 0.080%), Cape Verdean ($38,614, a difference of 0.11%), Immigrants from Jamaica ($38,625, a difference of 0.14%), and Immigrants from Ecuador ($38,644, a difference of 0.19%). Similarly, the demographic groups most similar to Slovaks are Panamanian ($39,049, a difference of 0.050%), Czech ($38,992, a difference of 0.090%), Immigrants from Uruguay ($38,945, a difference of 0.22%), Immigrants from Colombia ($38,913, a difference of 0.30%), and Immigrants from Bosnia and Herzegovina ($38,886, a difference of 0.37%).
| Demographics | Rating | Rank | Median Female Earnings |
| Panamanians | 20.6 /100 | #201 | Fair $39,049 |
| Slovaks | 19.9 /100 | #202 | Poor $39,029 |
| Czechs | 18.7 /100 | #203 | Poor $38,992 |
| Immigrants | Uruguay | 17.3 /100 | #204 | Poor $38,945 |
| Immigrants | Colombia | 16.3 /100 | #205 | Poor $38,913 |
| Immigrants | Bosnia and Herzegovina | 15.6 /100 | #206 | Poor $38,886 |
| Immigrants | Cambodia | 14.2 /100 | #207 | Poor $38,833 |
| Immigrants | Thailand | 13.6 /100 | #208 | Poor $38,810 |
| Norwegians | 13.4 /100 | #209 | Poor $38,802 |
| Czechoslovakians | 12.0 /100 | #210 | Poor $38,738 |
| Aleuts | 11.6 /100 | #211 | Poor $38,719 |
| Guamanians/Chamorros | 11.5 /100 | #212 | Poor $38,717 |
| Jamaicans | 10.5 /100 | #213 | Poor $38,670 |
| Iraqis | 10.5 /100 | #214 | Poor $38,666 |
| Spaniards | 10.3 /100 | #215 | Poor $38,656 |
| Immigrants | Ecuador | 10.1 /100 | #216 | Poor $38,644 |
| Immigrants | Jamaica | 9.7 /100 | #217 | Tragic $38,625 |
| Cape Verdeans | 9.5 /100 | #218 | Tragic $38,614 |
| Nepalese | 9.3 /100 | #219 | Tragic $38,603 |
| Yugoslavians | 8.8 /100 | #220 | Tragic $38,573 |
| Immigrants | Azores | 8.8 /100 | #221 | Tragic $38,573 |