Immigrants from the Azores vs Paraguayan Householder Income Over 65 years

COMPARE

Immigrants from the Azores
Race
Ancestry
AfghanAfricanAlaska NativeAlaskan AthabascanAlbanianAleutAlsatianAmericanApacheArabArapahoArgentineanArmenianAssyrian/Chaldean/SyriacAustralianAustrianBahamianBangladeshiBarbadianBasqueBelgianBelizeanBermudanBhutaneseBlackfeetBolivianBrazilianBritishBritish West IndianBulgarianBurmeseCajunCambodianCanadianCape VerdeanCarpatho RusynCelticCentral AmericanCentral American IndianCherokeeCheyenneChickasawChileanChineseChippewaChoctawColombianColvilleComancheCosta RicanCreeCreekCroatianCrowCubanCypriotCzechCzechoslovakianDanishDelawareDominicanDutchDutch West IndianEastern EuropeanEcuadorianEgyptianEnglishEstonianEthiopianEuropeanFijianFilipinoFinnishFrenchFrench American IndianFrench CanadianGermanGerman RussianGhanaianGreekGuamanian/ChamorroGuatemalanGuyaneseHaitianHmongHonduranHopiHoumaHungarianIcelanderIndian (Asian)IndonesianInupiatIranianIraqiIrishIroquoisIsraeliItalianJamaicanJapaneseJordanianKenyanKiowaKoreanLaotianLatvianLebaneseLiberianLithuanianLumbeeLuxembourgerMacedonianMalaysianMalteseMarshalleseMenomineeMexicanMexican American IndianMongolianMoroccanNative HawaiianNavajoNepaleseNew ZealanderNicaraguanNigerianNorthern EuropeanNorwegianOkinawanOsageOttawaPaiutePakistaniPalestinianPanamanianPennsylvania GermanPeruvianPimaPolishPortuguesePotawatomiPuebloPuerto RicanPuget Sound SalishRomanianRussianSalvadoranSamoanScandinavianScotch-IrishScottishSeminoleSenegaleseSerbianShoshoneSierra LeoneanSiouxSlavicSlovakSloveneSomaliSouth AfricanSouth AmericanSouth American IndianSoviet UnionSpaniardSpanishSpanish AmericanSpanish American IndianSri LankanSubsaharan AfricanSudaneseSwedishSwissSyrianTaiwaneseThaiTlingit-HaidaTohono O'OdhamTonganTrinidadian and TobagonianTsimshianTurkishU.S. Virgin IslanderUgandanUkrainianUruguayanUteVenezuelanVietnameseWelshWest IndianYakamaYaquiYugoslavianYumanYup'ikZimbabwean
Immigration
NonimmigrantsImmigrantsAfghanistanAfricaAlbaniaArgentinaArmeniaAsiaAustraliaAustriaBahamasBangladeshBarbadosBelarusBelgiumBelizeBoliviaBosnia and HerzegovinaBrazilBulgariaBurma/MyanmarCabo VerdeCambodiaCameroonCanadaCaribbeanCentral AmericaChileChinaColombiaCongoCosta RicaCroatiaCubaCzechoslovakiaDenmarkDominicaDominican RepublicEastern AfricaEastern AsiaEastern EuropeEcuadorEgyptEl SalvadorEnglandEritreaEthiopiaEuropeFijiFranceGermanyGhanaGreeceGrenadaGuatemalaGuyanaHaitiHondurasHong KongHungaryIndiaIndonesiaIranIraqIrelandIsraelItalyJamaicaJapanJordanKazakhstanKenyaKoreaKuwaitLaosLatin AmericaLatviaLebanonLiberiaLithuaniaMalaysiaMexicoMicronesiaMiddle AfricaMoldovaMoroccoNepalNetherlandsNicaraguaNigeriaNorth AmericaNorth MacedoniaNorthern AfricaNorthern EuropeNorwayOceaniaPakistanPanamaPeruPhilippinesPolandPortugalRomaniaRussiaSaudi ArabiaScotlandSenegalSerbiaSierra LeoneSingaporeSomaliaSouth AfricaSouth AmericaSouth Central AsiaSouth Eastern AsiaSouthern EuropeSpainSri LankaSt. Vincent and the GrenadinesSudanSwedenSwitzerlandSyriaTaiwanThailandTrinidad and TobagoTurkeyUgandaUkraineUruguayUzbekistanVenezuelaVietnamWest IndiesWestern AfricaWestern AsiaWestern EuropeYemenZaireZimbabweAzores
Paraguayan
Race
Ancestry
AfghanAfricanAlaska NativeAlaskan AthabascanAlbanianAleutAlsatianAmericanApacheArabArapahoArgentineanArmenianAssyrian/Chaldean/SyriacAustralianAustrianBahamianBangladeshiBarbadianBasqueBelgianBelizeanBermudanBhutaneseBlackfeetBolivianBrazilianBritishBritish West IndianBulgarianBurmeseCajunCambodianCanadianCape VerdeanCarpatho RusynCelticCentral AmericanCentral American IndianCherokeeCheyenneChickasawChileanChineseChippewaChoctawColombianColvilleComancheCosta RicanCreeCreekCroatianCrowCubanCypriotCzechCzechoslovakianDanishDelawareDominicanDutchDutch West IndianEastern EuropeanEcuadorianEgyptianEnglishEstonianEthiopianEuropeanFijianFilipinoFinnishFrenchFrench American IndianFrench CanadianGermanGerman RussianGhanaianGreekGuamanian/ChamorroGuatemalanGuyaneseHaitianHmongHonduranHopiHoumaHungarianIcelanderIndian (Asian)IndonesianInupiatIranianIraqiIrishIroquoisIsraeliItalianJamaicanJapaneseJordanianKenyanKiowaKoreanLaotianLatvianLebaneseLiberianLithuanianLumbeeLuxembourgerMacedonianMalaysianMalteseMarshalleseMenomineeMexicanMexican American IndianMongolianMoroccanNative HawaiianNavajoNepaleseNew ZealanderNicaraguanNigerianNorthern EuropeanNorwegianOkinawanOsageOttawaPaiutePakistaniPalestinianPanamanianParaguayanPennsylvania GermanPeruvianPimaPolishPortuguesePotawatomiPuebloPuerto RicanPuget Sound SalishRomanianRussianSalvadoranSamoanScandinavianScotch-IrishScottishSeminoleSenegaleseSerbianShoshoneSierra LeoneanSiouxSlavicSlovakSloveneSomaliSouth AfricanSouth AmericanSouth American IndianSoviet UnionSpaniardSpanishSpanish AmericanSpanish American IndianSri LankanSubsaharan AfricanSudaneseSwedishSwissSyrianTaiwaneseThaiTlingit-HaidaTohono O'OdhamTonganTrinidadian and TobagonianTsimshianTurkishU.S. Virgin IslanderUgandanUkrainianUruguayanUteVenezuelanVietnameseWelshWest IndianYakamaYaquiYugoslavianYumanYup'ikZimbabwean
Immigration
NonimmigrantsImmigrantsAfghanistanAfricaAlbaniaArgentinaArmeniaAsiaAustraliaAustriaBahamasBangladeshBarbadosBelarusBelgiumBelizeBoliviaBosnia and HerzegovinaBrazilBulgariaBurma/MyanmarCabo VerdeCambodiaCameroonCanadaCaribbeanCentral AmericaChileChinaColombiaCongoCosta RicaCroatiaCubaCzechoslovakiaDenmarkDominicaDominican RepublicEastern AfricaEastern AsiaEastern EuropeEcuadorEgyptEl SalvadorEnglandEritreaEthiopiaEuropeFijiFranceGermanyGhanaGreeceGrenadaGuatemalaGuyanaHaitiHondurasHong KongHungaryIndiaIndonesiaIranIraqIrelandIsraelItalyJamaicaJapanJordanKazakhstanKenyaKoreaKuwaitLaosLatin AmericaLatviaLebanonLiberiaLithuaniaMalaysiaMexicoMicronesiaMiddle AfricaMoldovaMoroccoNepalNetherlandsNicaraguaNigeriaNorth AmericaNorth MacedoniaNorthern AfricaNorthern EuropeNorwayOceaniaPakistanPanamaPeruPhilippinesPolandPortugalRomaniaRussiaSaudi ArabiaScotlandSenegalSerbiaSierra LeoneSingaporeSomaliaSouth AfricaSouth AmericaSouth Central AsiaSouth Eastern AsiaSouthern EuropeSpainSri LankaSt. Vincent and the GrenadinesSudanSwedenSwitzerlandSyriaTaiwanThailandTrinidad and TobagoTurkeyUgandaUkraineUruguayUzbekistanVenezuelaVietnamWest IndiesWestern AfricaWestern AsiaWestern EuropeYemenZaireZimbabwe
Householder Income Over 65 years
Income
Poverty
Unemployment
Labor Participation
Family Structure
Vehicle Availability
Education Level
Disability

Householder Income Over 65 years Comparison

Immigrants from the Azores

Paraguayans

Tragic
Exceptional
$52,121
HOUSEHOLDER INCOME OVER 65 YEARS
0.0/ 100
METRIC RATING
312th/ 347
METRIC RANK
$64,443
HOUSEHOLDER INCOME OVER 65 YEARS
97.4/ 100
METRIC RATING
89th/ 347
METRIC RANK

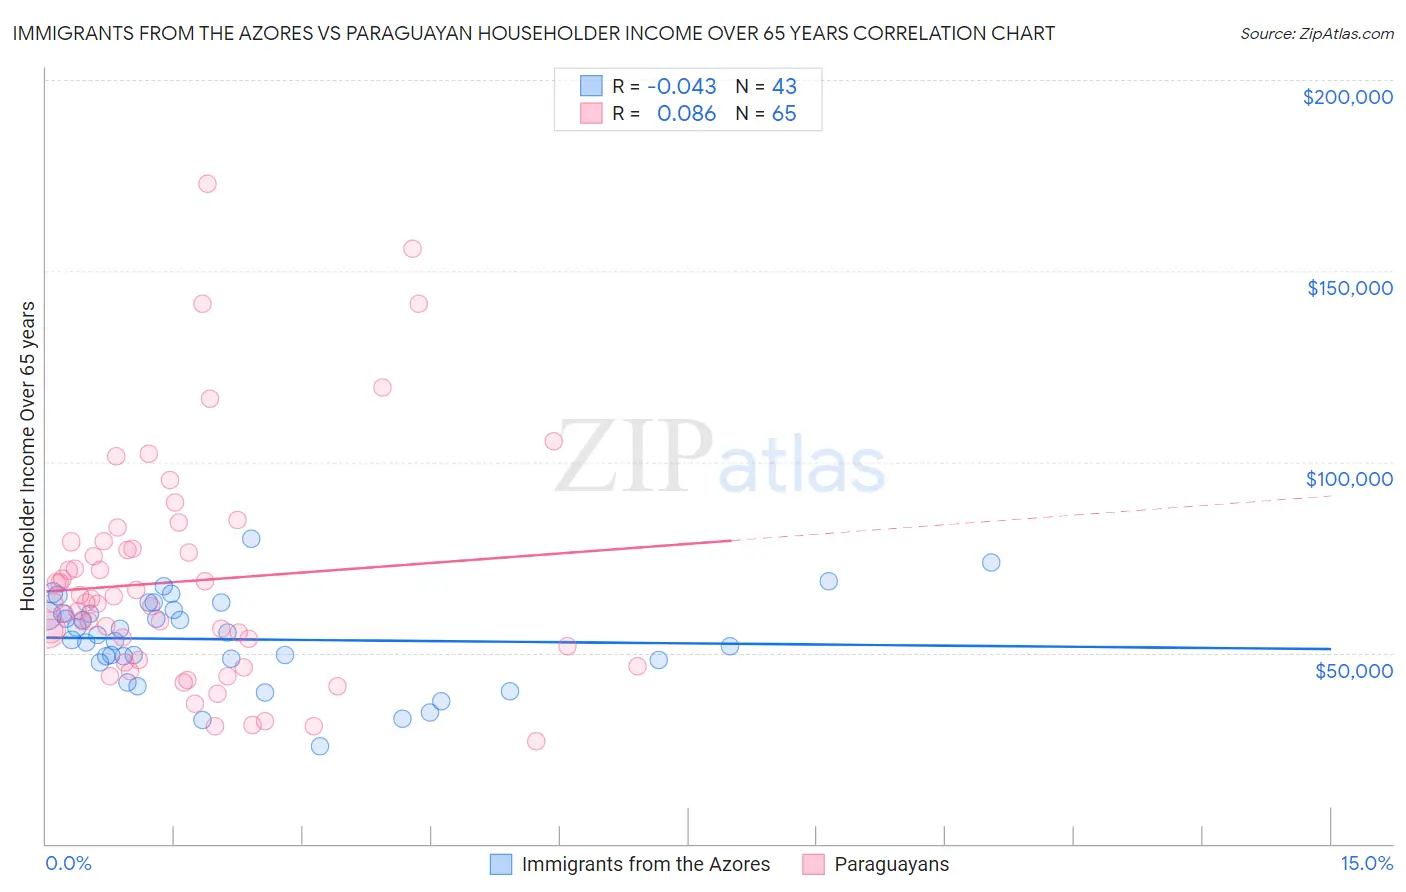
Immigrants from the Azores vs Paraguayan Householder Income Over 65 years Correlation Chart

The statistical analysis conducted on geographies consisting of 46,235,757 people shows no correlation between the proportion of Immigrants from the Azores and household income with householder over the age of 65 in the United States with a correlation coefficient (R) of -0.043 and weighted average of $52,121. Similarly, the statistical analysis conducted on geographies consisting of 95,003,306 people shows a slight positive correlation between the proportion of Paraguayans and household income with householder over the age of 65 in the United States with a correlation coefficient (R) of 0.086 and weighted average of $64,443, a difference of 23.6%.
Immigrants from the Azores vs Paraguayan Householder Income Over 65 years

Householder Income Over 65 years Correlation Summary

MeasurementImmigrants from the AzoresParaguayan
Minimum$25,525$26,765
Maximum$79,808$172,969
Range$54,283$146,204
Mean$53,519$68,770
Median$54,701$63,287
Interquartile 25% (IQ1)$48,125$47,789
Interquartile 75% (IQ3)$61,191$78,220
Interquartile Range (IQR)$13,066$30,430
Standard Deviation (Sample)$11,644$29,858
Standard Deviation (Population)$11,508$29,627

Similar Demographics by Householder Income Over 65 years

Demographics Similar to Immigrants from the Azores by Householder Income Over 65 years

In terms of householder income over 65 years, the demographic groups most similar to Immigrants from the Azores are Immigrants from Nicaragua ($52,085, a difference of 0.070%), Native/Alaskan ($52,081, a difference of 0.080%), U.S. Virgin Islander ($52,072, a difference of 0.090%), Creek ($51,949, a difference of 0.33%), and Immigrants from St. Vincent and the Grenadines ($51,922, a difference of 0.38%).
DemographicsRating | RankHouseholder Income Over 65 years
Pueblo
0.0
/100
|
#305
Tragic
$52,930
Pennsylvania Germans
0.0
/100
|
#306
Tragic
$52,888
Hispanics or Latinos
0.0
/100
|
#307
Tragic
$52,832
Immigrants | Mexico
0.0
/100
|
#308
Tragic
$52,801
Hondurans
0.0
/100
|
#309
Tragic
$52,634
Sioux
0.0
/100
|
#310
Tragic
$52,509
Seminole
0.0
/100
|
#311
Tragic
$52,373
Immigrants | Azores
0.0
/100
|
#312
Tragic
$52,121
Immigrants | Nicaragua
0.0
/100
|
#313
Tragic
$52,085
Natives/Alaskans
0.0
/100
|
#314
Tragic
$52,081
U.S. Virgin Islanders
0.0
/100
|
#315
Tragic
$52,072
Creek
0.0
/100
|
#316
Tragic
$51,949
Immigrants | St. Vincent and the Grenadines
0.0
/100
|
#317
Tragic
$51,922
Haitians
0.0
/100
|
#318
Tragic
$51,912
Immigrants | Honduras
0.0
/100
|
#319
Tragic
$51,888

Demographics Similar to Paraguayans by Householder Income Over 65 years

In terms of householder income over 65 years, the demographic groups most similar to Paraguayans are Immigrants from Kuwait ($64,433, a difference of 0.020%), Immigrants from Romania ($64,462, a difference of 0.030%), Austrian ($64,470, a difference of 0.040%), Immigrants from Oceania ($64,416, a difference of 0.040%), and Immigrants from Bulgaria ($64,379, a difference of 0.10%).
DemographicsRating | RankHouseholder Income Over 65 years
Immigrants | Fiji
98.2
/100
|
#82
Exceptional
$64,795
Northern Europeans
97.9
/100
|
#83
Exceptional
$64,658
Immigrants | Greece
97.9
/100
|
#84
Exceptional
$64,636
Immigrants | Lebanon
97.6
/100
|
#85
Exceptional
$64,521
Immigrants | Russia
97.6
/100
|
#86
Exceptional
$64,512
Austrians
97.5
/100
|
#87
Exceptional
$64,470
Immigrants | Romania
97.5
/100
|
#88
Exceptional
$64,462
Paraguayans
97.4
/100
|
#89
Exceptional
$64,443
Immigrants | Kuwait
97.4
/100
|
#90
Exceptional
$64,433
Immigrants | Oceania
97.4
/100
|
#91
Exceptional
$64,416
Immigrants | Bulgaria
97.3
/100
|
#92
Exceptional
$64,379
Jordanians
97.1
/100
|
#93
Exceptional
$64,313
Immigrants | Egypt
97.0
/100
|
#94
Exceptional
$64,299
Immigrants | Latvia
97.0
/100
|
#95
Exceptional
$64,298
Immigrants | Hungary
97.0
/100
|
#96
Exceptional
$64,277