Immigrants from the Azores vs Bangladeshi Householder Income Ages 45 - 64 years

COMPARE

Immigrants from the Azores
Race
Ancestry
AfghanAfricanAlaska NativeAlaskan AthabascanAlbanianAleutAlsatianAmericanApacheArabArapahoArgentineanArmenianAssyrian/Chaldean/SyriacAustralianAustrianBahamianBarbadianBasqueBelgianBelizeanBermudanBhutaneseBlackfeetBolivianBrazilianBritishBritish West IndianBulgarianBurmeseCajunCambodianCanadianCape VerdeanCarpatho RusynCelticCentral AmericanCentral American IndianCherokeeCheyenneChickasawChileanChineseChippewaChoctawColombianColvilleComancheCosta RicanCreeCreekCroatianCrowCubanCypriotCzechCzechoslovakianDanishDelawareDominicanDutchDutch West IndianEastern EuropeanEcuadorianEgyptianEnglishEstonianEthiopianEuropeanFijianFilipinoFinnishFrenchFrench American IndianFrench CanadianGermanGerman RussianGhanaianGreekGuamanian/ChamorroGuatemalanGuyaneseHaitianHmongHonduranHopiHoumaHungarianIcelanderIndian (Asian)IndonesianInupiatIranianIraqiIrishIroquoisIsraeliItalianJamaicanJapaneseJordanianKenyanKiowaKoreanLaotianLatvianLebaneseLiberianLithuanianLumbeeLuxembourgerMacedonianMalaysianMalteseMarshalleseMenomineeMexicanMexican American IndianMongolianMoroccanNative HawaiianNavajoNepaleseNew ZealanderNicaraguanNigerianNorthern EuropeanNorwegianOkinawanOsageOttawaPaiutePakistaniPalestinianPanamanianParaguayanPennsylvania GermanPeruvianPimaPolishPortuguesePotawatomiPuebloPuerto RicanPuget Sound SalishRomanianRussianSalvadoranSamoanScandinavianScotch-IrishScottishSeminoleSenegaleseSerbianShoshoneSierra LeoneanSiouxSlavicSlovakSloveneSomaliSouth AfricanSouth AmericanSouth American IndianSoviet UnionSpaniardSpanishSpanish AmericanSpanish American IndianSri LankanSubsaharan AfricanSudaneseSwedishSwissSyrianTaiwaneseThaiTlingit-HaidaTohono O'OdhamTonganTrinidadian and TobagonianTsimshianTurkishU.S. Virgin IslanderUgandanUkrainianUruguayanUteVenezuelanVietnameseWelshWest IndianYakamaYaquiYugoslavianYumanYup'ikZimbabwean
Immigration
NonimmigrantsImmigrantsAfghanistanAfricaAlbaniaArgentinaArmeniaAsiaAustraliaAustriaBahamasBangladeshBarbadosBelarusBelgiumBelizeBoliviaBosnia and HerzegovinaBrazilBulgariaBurma/MyanmarCabo VerdeCambodiaCameroonCanadaCaribbeanCentral AmericaChileChinaColombiaCongoCosta RicaCroatiaCubaCzechoslovakiaDenmarkDominicaDominican RepublicEastern AfricaEastern AsiaEastern EuropeEcuadorEgyptEl SalvadorEnglandEritreaEthiopiaEuropeFijiFranceGermanyGhanaGreeceGrenadaGuatemalaGuyanaHaitiHondurasHong KongHungaryIndiaIndonesiaIranIraqIrelandIsraelItalyJamaicaJapanJordanKazakhstanKenyaKoreaKuwaitLaosLatin AmericaLatviaLebanonLiberiaLithuaniaMalaysiaMexicoMicronesiaMiddle AfricaMoldovaMoroccoNepalNetherlandsNicaraguaNigeriaNorth AmericaNorth MacedoniaNorthern AfricaNorthern EuropeNorwayOceaniaPakistanPanamaPeruPhilippinesPolandPortugalRomaniaRussiaSaudi ArabiaScotlandSenegalSerbiaSierra LeoneSingaporeSomaliaSouth AfricaSouth AmericaSouth Central AsiaSouth Eastern AsiaSouthern EuropeSpainSri LankaSt. Vincent and the GrenadinesSudanSwedenSwitzerlandSyriaTaiwanThailandTrinidad and TobagoTurkeyUgandaUkraineUruguayUzbekistanVenezuelaVietnamWest IndiesWestern AfricaWestern AsiaWestern EuropeYemenZaireZimbabweAzores
Bangladeshi
Race
Ancestry
AfghanAfricanAlaska NativeAlaskan AthabascanAlbanianAleutAlsatianAmericanApacheArabArapahoArgentineanArmenianAssyrian/Chaldean/SyriacAustralianAustrianBahamianBangladeshiBarbadianBasqueBelgianBelizeanBermudanBhutaneseBlackfeetBolivianBrazilianBritishBritish West IndianBulgarianBurmeseCajunCambodianCanadianCape VerdeanCarpatho RusynCelticCentral AmericanCentral American IndianCherokeeCheyenneChickasawChileanChineseChippewaChoctawColombianColvilleComancheCosta RicanCreeCreekCroatianCrowCubanCypriotCzechCzechoslovakianDanishDelawareDominicanDutchDutch West IndianEastern EuropeanEcuadorianEgyptianEnglishEstonianEthiopianEuropeanFijianFilipinoFinnishFrenchFrench American IndianFrench CanadianGermanGerman RussianGhanaianGreekGuamanian/ChamorroGuatemalanGuyaneseHaitianHmongHonduranHopiHoumaHungarianIcelanderIndian (Asian)IndonesianInupiatIranianIraqiIrishIroquoisIsraeliItalianJamaicanJapaneseJordanianKenyanKiowaKoreanLaotianLatvianLebaneseLiberianLithuanianLumbeeLuxembourgerMacedonianMalaysianMalteseMarshalleseMenomineeMexicanMexican American IndianMongolianMoroccanNative HawaiianNavajoNepaleseNew ZealanderNicaraguanNigerianNorthern EuropeanNorwegianOkinawanOsageOttawaPaiutePakistaniPalestinianPanamanianParaguayanPennsylvania GermanPeruvianPimaPolishPortuguesePotawatomiPuebloPuerto RicanPuget Sound SalishRomanianRussianSalvadoranSamoanScandinavianScotch-IrishScottishSeminoleSenegaleseSerbianShoshoneSierra LeoneanSiouxSlavicSlovakSloveneSomaliSouth AfricanSouth AmericanSouth American IndianSoviet UnionSpaniardSpanishSpanish AmericanSpanish American IndianSri LankanSubsaharan AfricanSudaneseSwedishSwissSyrianTaiwaneseThaiTlingit-HaidaTohono O'OdhamTonganTrinidadian and TobagonianTsimshianTurkishU.S. Virgin IslanderUgandanUkrainianUruguayanUteVenezuelanVietnameseWelshWest IndianYakamaYaquiYugoslavianYumanYup'ikZimbabwean
Immigration
NonimmigrantsImmigrantsAfghanistanAfricaAlbaniaArgentinaArmeniaAsiaAustraliaAustriaBahamasBangladeshBarbadosBelarusBelgiumBelizeBoliviaBosnia and HerzegovinaBrazilBulgariaBurma/MyanmarCabo VerdeCambodiaCameroonCanadaCaribbeanCentral AmericaChileChinaColombiaCongoCosta RicaCroatiaCubaCzechoslovakiaDenmarkDominicaDominican RepublicEastern AfricaEastern AsiaEastern EuropeEcuadorEgyptEl SalvadorEnglandEritreaEthiopiaEuropeFijiFranceGermanyGhanaGreeceGrenadaGuatemalaGuyanaHaitiHondurasHong KongHungaryIndiaIndonesiaIranIraqIrelandIsraelItalyJamaicaJapanJordanKazakhstanKenyaKoreaKuwaitLaosLatin AmericaLatviaLebanonLiberiaLithuaniaMalaysiaMexicoMicronesiaMiddle AfricaMoldovaMoroccoNepalNetherlandsNicaraguaNigeriaNorth AmericaNorth MacedoniaNorthern AfricaNorthern EuropeNorwayOceaniaPakistanPanamaPeruPhilippinesPolandPortugalRomaniaRussiaSaudi ArabiaScotlandSenegalSerbiaSierra LeoneSingaporeSomaliaSouth AfricaSouth AmericaSouth Central AsiaSouth Eastern AsiaSouthern EuropeSpainSri LankaSt. Vincent and the GrenadinesSudanSwedenSwitzerlandSyriaTaiwanThailandTrinidad and TobagoTurkeyUgandaUkraineUruguayUzbekistanVenezuelaVietnamWest IndiesWestern AfricaWestern AsiaWestern EuropeYemenZaireZimbabwe
Householder Income Ages 45 - 64 years
Income
Poverty
Unemployment
Labor Participation
Family Structure
Vehicle Availability
Education Level
Disability

Householder Income Ages 45 - 64 years Comparison

Immigrants from the Azores

Bangladeshis

Tragic
Tragic
$94,138
HOUSEHOLDER INCOME AGES 45 - 64 YEARS
4.3/ 100
METRIC RATING
226th/ 347
METRIC RANK
$86,402
HOUSEHOLDER INCOME AGES 45 - 64 YEARS
0.1/ 100
METRIC RATING
287th/ 347
METRIC RANK

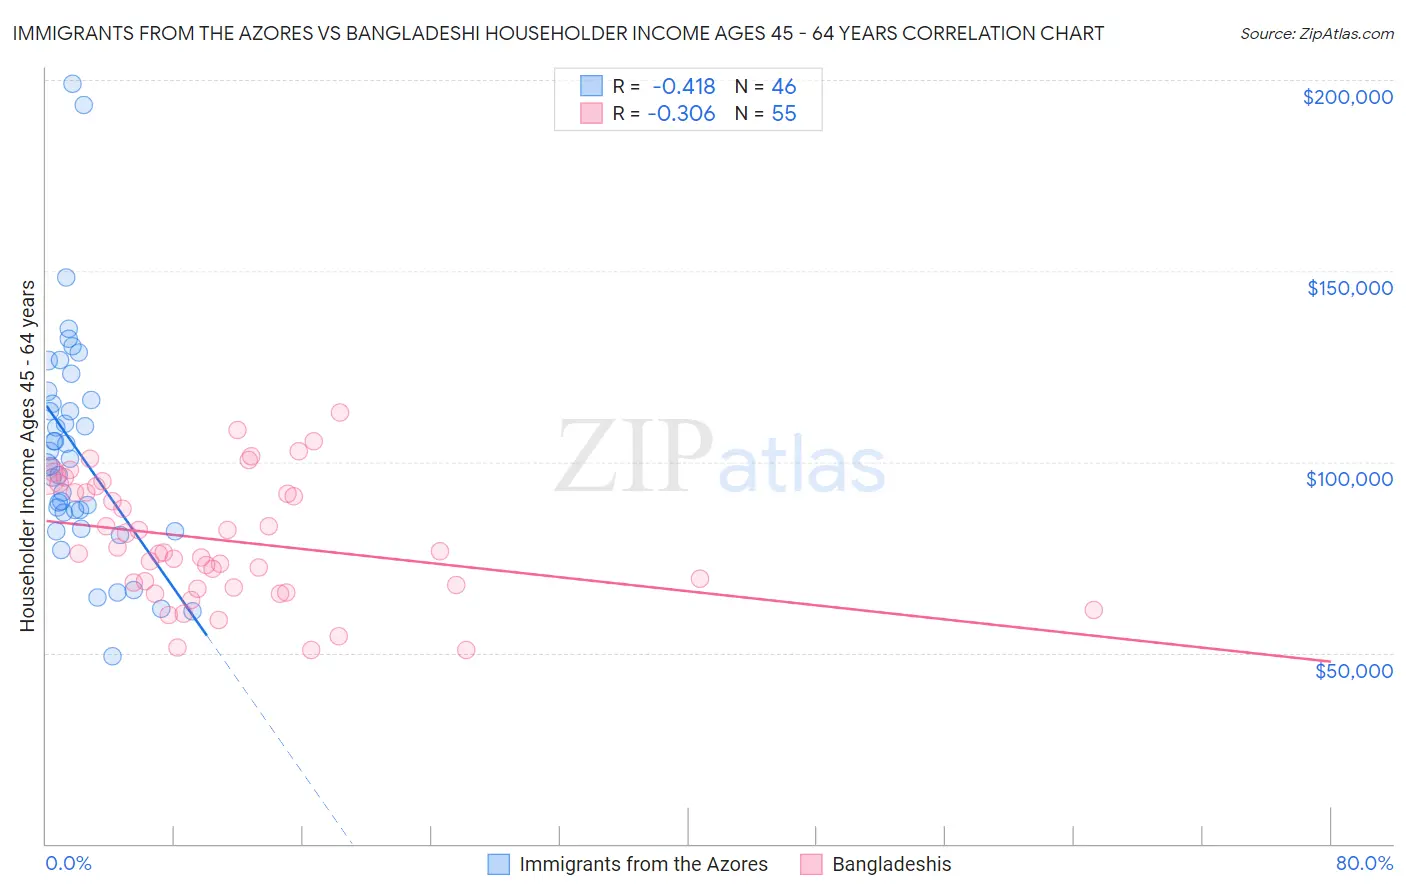
Immigrants from the Azores vs Bangladeshi Householder Income Ages 45 - 64 years Correlation Chart

The statistical analysis conducted on geographies consisting of 46,245,378 people shows a moderate negative correlation between the proportion of Immigrants from the Azores and household income with householder between the ages 45 and 64 in the United States with a correlation coefficient (R) of -0.418 and weighted average of $94,138. Similarly, the statistical analysis conducted on geographies consisting of 141,236,471 people shows a mild negative correlation between the proportion of Bangladeshis and household income with householder between the ages 45 and 64 in the United States with a correlation coefficient (R) of -0.306 and weighted average of $86,402, a difference of 8.9%.
Immigrants from the Azores vs Bangladeshi Householder Income Ages 45 - 64 years

Householder Income Ages 45 - 64 years Correlation Summary

MeasurementImmigrants from the AzoresBangladeshi
Minimum$49,083$50,598
Maximum$198,981$113,000
Range$149,898$62,402
Mean$103,017$79,486
Median$100,003$76,107
Interquartile 25% (IQ1)$86,798$66,969
Interquartile 75% (IQ3)$116,103$93,746
Interquartile Range (IQR)$29,305$26,777
Standard Deviation (Sample)$29,838$15,976
Standard Deviation (Population)$29,512$15,831

Similar Demographics by Householder Income Ages 45 - 64 years

Demographics Similar to Immigrants from the Azores by Householder Income Ages 45 - 64 years

In terms of householder income ages 45 - 64 years, the demographic groups most similar to Immigrants from the Azores are Bermudan ($94,197, a difference of 0.060%), Immigrants from Bosnia and Herzegovina ($94,288, a difference of 0.16%), Alaska Native ($93,991, a difference of 0.16%), Nonimmigrants ($94,448, a difference of 0.33%), and Immigrants from Panama ($93,815, a difference of 0.34%).
DemographicsRating | RankHouseholder Income Ages 45 - 64 years
Immigrants | Armenia
6.1
/100
|
#219
Tragic
$94,863
Salvadorans
6.0
/100
|
#220
Tragic
$94,842
Immigrants | Nigeria
5.9
/100
|
#221
Tragic
$94,804
Malaysians
5.2
/100
|
#222
Tragic
$94,517
Immigrants | Nonimmigrants
5.0
/100
|
#223
Tragic
$94,448
Immigrants | Bosnia and Herzegovina
4.6
/100
|
#224
Tragic
$94,288
Bermudans
4.4
/100
|
#225
Tragic
$94,197
Immigrants | Azores
4.3
/100
|
#226
Tragic
$94,138
Alaska Natives
4.0
/100
|
#227
Tragic
$93,991
Immigrants | Panama
3.7
/100
|
#228
Tragic
$93,815
Vietnamese
3.6
/100
|
#229
Tragic
$93,788
Immigrants | Sudan
3.6
/100
|
#230
Tragic
$93,781
Ecuadorians
3.6
/100
|
#231
Tragic
$93,739
Sudanese
3.5
/100
|
#232
Tragic
$93,718
Nepalese
3.0
/100
|
#233
Tragic
$93,355

Demographics Similar to Bangladeshis by Householder Income Ages 45 - 64 years

In terms of householder income ages 45 - 64 years, the demographic groups most similar to Bangladeshis are Immigrants from St. Vincent and the Grenadines ($86,394, a difference of 0.010%), Cuban ($86,301, a difference of 0.12%), Immigrants from Guatemala ($86,573, a difference of 0.20%), Blackfeet ($86,595, a difference of 0.22%), and Cherokee ($86,125, a difference of 0.32%).
DemographicsRating | RankHouseholder Income Ages 45 - 64 years
Immigrants | Somalia
0.1
/100
|
#280
Tragic
$86,987
Yaqui
0.1
/100
|
#281
Tragic
$86,914
Senegalese
0.1
/100
|
#282
Tragic
$86,897
Mexicans
0.1
/100
|
#283
Tragic
$86,816
Central American Indians
0.1
/100
|
#284
Tragic
$86,764
Blackfeet
0.1
/100
|
#285
Tragic
$86,595
Immigrants | Guatemala
0.1
/100
|
#286
Tragic
$86,573
Bangladeshis
0.1
/100
|
#287
Tragic
$86,402
Immigrants | St. Vincent and the Grenadines
0.1
/100
|
#288
Tragic
$86,394
Cubans
0.1
/100
|
#289
Tragic
$86,301
Cherokee
0.1
/100
|
#290
Tragic
$86,125
Hispanics or Latinos
0.1
/100
|
#291
Tragic
$86,006
Immigrants | Central America
0.1
/100
|
#292
Tragic
$85,965
Comanche
0.1
/100
|
#293
Tragic
$85,787
British West Indians
0.1
/100
|
#294
Tragic
$85,571