Immigrants from Armenia vs Arab Householder Income Ages 45 - 64 years

COMPARE

Immigrants from Armenia
Race
Ancestry
AfghanAfricanAlaska NativeAlaskan AthabascanAlbanianAleutAlsatianAmericanApacheArapahoArgentineanArmenianAssyrian/Chaldean/SyriacAustralianAustrianBahamianBangladeshiBarbadianBasqueBelgianBelizeanBermudanBhutaneseBlackfeetBolivianBrazilianBritishBritish West IndianBulgarianBurmeseCajunCambodianCanadianCape VerdeanCarpatho RusynCelticCentral AmericanCentral American IndianCherokeeCheyenneChickasawChileanChineseChippewaChoctawColombianColvilleComancheCosta RicanCreeCreekCroatianCrowCubanCypriotCzechCzechoslovakianDanishDelawareDominicanDutchDutch West IndianEastern EuropeanEcuadorianEgyptianEnglishEstonianEthiopianEuropeanFijianFilipinoFinnishFrenchFrench American IndianFrench CanadianGermanGerman RussianGhanaianGreekGuamanian/ChamorroGuatemalanGuyaneseHaitianHmongHonduranHopiHoumaHungarianIcelanderIndian (Asian)IndonesianInupiatIranianIraqiIrishIroquoisIsraeliItalianJamaicanJapaneseJordanianKenyanKiowaKoreanLaotianLatvianLebaneseLiberianLithuanianLumbeeLuxembourgerMacedonianMalaysianMalteseMarshalleseMenomineeMexicanMexican American IndianMongolianMoroccanNative HawaiianNavajoNepaleseNew ZealanderNicaraguanNigerianNorthern EuropeanNorwegianOkinawanOsageOttawaPaiutePakistaniPalestinianPanamanianParaguayanPennsylvania GermanPeruvianPimaPolishPortuguesePotawatomiPuebloPuerto RicanPuget Sound SalishRomanianRussianSalvadoranSamoanScandinavianScotch-IrishScottishSeminoleSenegaleseSerbianShoshoneSierra LeoneanSiouxSlavicSlovakSloveneSomaliSouth AfricanSouth AmericanSouth American IndianSoviet UnionSpaniardSpanishSpanish AmericanSpanish American IndianSri LankanSubsaharan AfricanSudaneseSwedishSwissSyrianTaiwaneseThaiTlingit-HaidaTohono O'OdhamTonganTrinidadian and TobagonianTsimshianTurkishU.S. Virgin IslanderUgandanUkrainianUruguayanUteVenezuelanVietnameseWelshWest IndianYakamaYaquiYugoslavianYumanYup'ikZimbabwean
Immigration
NonimmigrantsImmigrantsAfghanistanAfricaAlbaniaArgentinaArmeniaAsiaAustraliaAustriaBahamasBangladeshBarbadosBelarusBelgiumBelizeBoliviaBosnia and HerzegovinaBrazilBulgariaBurma/MyanmarCabo VerdeCambodiaCameroonCanadaCaribbeanCentral AmericaChileChinaColombiaCongoCosta RicaCroatiaCubaCzechoslovakiaDenmarkDominicaDominican RepublicEastern AfricaEastern AsiaEastern EuropeEcuadorEgyptEl SalvadorEnglandEritreaEthiopiaEuropeFijiFranceGermanyGhanaGreeceGrenadaGuatemalaGuyanaHaitiHondurasHong KongHungaryIndiaIndonesiaIranIraqIrelandIsraelItalyJamaicaJapanJordanKazakhstanKenyaKoreaKuwaitLaosLatin AmericaLatviaLebanonLiberiaLithuaniaMalaysiaMexicoMicronesiaMiddle AfricaMoldovaMoroccoNepalNetherlandsNicaraguaNigeriaNorth AmericaNorth MacedoniaNorthern AfricaNorthern EuropeNorwayOceaniaPakistanPanamaPeruPhilippinesPolandPortugalRomaniaRussiaSaudi ArabiaScotlandSenegalSerbiaSierra LeoneSingaporeSomaliaSouth AfricaSouth AmericaSouth Central AsiaSouth Eastern AsiaSouthern EuropeSpainSri LankaSt. Vincent and the GrenadinesSudanSwedenSwitzerlandSyriaTaiwanThailandTrinidad and TobagoTurkeyUgandaUkraineUruguayUzbekistanVenezuelaVietnamWest IndiesWestern AfricaWestern AsiaWestern EuropeYemenZaireZimbabweAzores
Arab
Race
Ancestry
AfghanAfricanAlaska NativeAlaskan AthabascanAlbanianAleutAlsatianAmericanApacheArabArapahoArgentineanArmenianAssyrian/Chaldean/SyriacAustralianAustrianBahamianBangladeshiBarbadianBasqueBelgianBelizeanBermudanBhutaneseBlackfeetBolivianBrazilianBritishBritish West IndianBulgarianBurmeseCajunCambodianCanadianCape VerdeanCarpatho RusynCelticCentral AmericanCentral American IndianCherokeeCheyenneChickasawChileanChineseChippewaChoctawColombianColvilleComancheCosta RicanCreeCreekCroatianCrowCubanCypriotCzechCzechoslovakianDanishDelawareDominicanDutchDutch West IndianEastern EuropeanEcuadorianEgyptianEnglishEstonianEthiopianEuropeanFijianFilipinoFinnishFrenchFrench American IndianFrench CanadianGermanGerman RussianGhanaianGreekGuamanian/ChamorroGuatemalanGuyaneseHaitianHmongHonduranHopiHoumaHungarianIcelanderIndian (Asian)IndonesianInupiatIranianIraqiIrishIroquoisIsraeliItalianJamaicanJapaneseJordanianKenyanKiowaKoreanLaotianLatvianLebaneseLiberianLithuanianLumbeeLuxembourgerMacedonianMalaysianMalteseMarshalleseMenomineeMexicanMexican American IndianMongolianMoroccanNative HawaiianNavajoNepaleseNew ZealanderNicaraguanNigerianNorthern EuropeanNorwegianOkinawanOsageOttawaPaiutePakistaniPalestinianPanamanianParaguayanPennsylvania GermanPeruvianPimaPolishPortuguesePotawatomiPuebloPuerto RicanPuget Sound SalishRomanianRussianSalvadoranSamoanScandinavianScotch-IrishScottishSeminoleSenegaleseSerbianShoshoneSierra LeoneanSiouxSlavicSlovakSloveneSomaliSouth AfricanSouth AmericanSouth American IndianSoviet UnionSpaniardSpanishSpanish AmericanSpanish American IndianSri LankanSubsaharan AfricanSudaneseSwedishSwissSyrianTaiwaneseThaiTlingit-HaidaTohono O'OdhamTonganTrinidadian and TobagonianTsimshianTurkishU.S. Virgin IslanderUgandanUkrainianUruguayanUteVenezuelanVietnameseWelshWest IndianYakamaYaquiYugoslavianYumanYup'ikZimbabwean
Immigration
NonimmigrantsImmigrantsAfghanistanAfricaAlbaniaArgentinaAsiaAustraliaAustriaBahamasBangladeshBarbadosBelarusBelgiumBelizeBoliviaBosnia and HerzegovinaBrazilBulgariaBurma/MyanmarCabo VerdeCambodiaCameroonCanadaCaribbeanCentral AmericaChileChinaColombiaCongoCosta RicaCroatiaCubaCzechoslovakiaDenmarkDominicaDominican RepublicEastern AfricaEastern AsiaEastern EuropeEcuadorEgyptEl SalvadorEnglandEritreaEthiopiaEuropeFijiFranceGermanyGhanaGreeceGrenadaGuatemalaGuyanaHaitiHondurasHong KongHungaryIndiaIndonesiaIranIraqIrelandIsraelItalyJamaicaJapanJordanKazakhstanKenyaKoreaKuwaitLaosLatin AmericaLatviaLebanonLiberiaLithuaniaMalaysiaMexicoMicronesiaMiddle AfricaMoldovaMoroccoNepalNetherlandsNicaraguaNigeriaNorth AmericaNorth MacedoniaNorthern AfricaNorthern EuropeNorwayOceaniaPakistanPanamaPeruPhilippinesPolandPortugalRomaniaRussiaSaudi ArabiaScotlandSenegalSerbiaSierra LeoneSingaporeSomaliaSouth AfricaSouth AmericaSouth Central AsiaSouth Eastern AsiaSouthern EuropeSpainSri LankaSt. Vincent and the GrenadinesSudanSwedenSwitzerlandSyriaTaiwanThailandTrinidad and TobagoTurkeyUgandaUkraineUruguayUzbekistanVenezuelaVietnamWest IndiesWestern AfricaWestern AsiaWestern EuropeYemenZaireZimbabweAzores
Householder Income Ages 45 - 64 years
Income
Poverty
Unemployment
Labor Participation
Family Structure
Vehicle Availability
Education Level
Disability

Householder Income Ages 45 - 64 years Comparison

Immigrants from Armenia

Arabs

Tragic
Excellent
$94,863
HOUSEHOLDER INCOME AGES 45 - 64 YEARS
6.1/ 100
METRIC RATING
219th/ 347
METRIC RANK
$104,566
HOUSEHOLDER INCOME AGES 45 - 64 YEARS
89.3/ 100
METRIC RATING
133rd/ 347
METRIC RANK

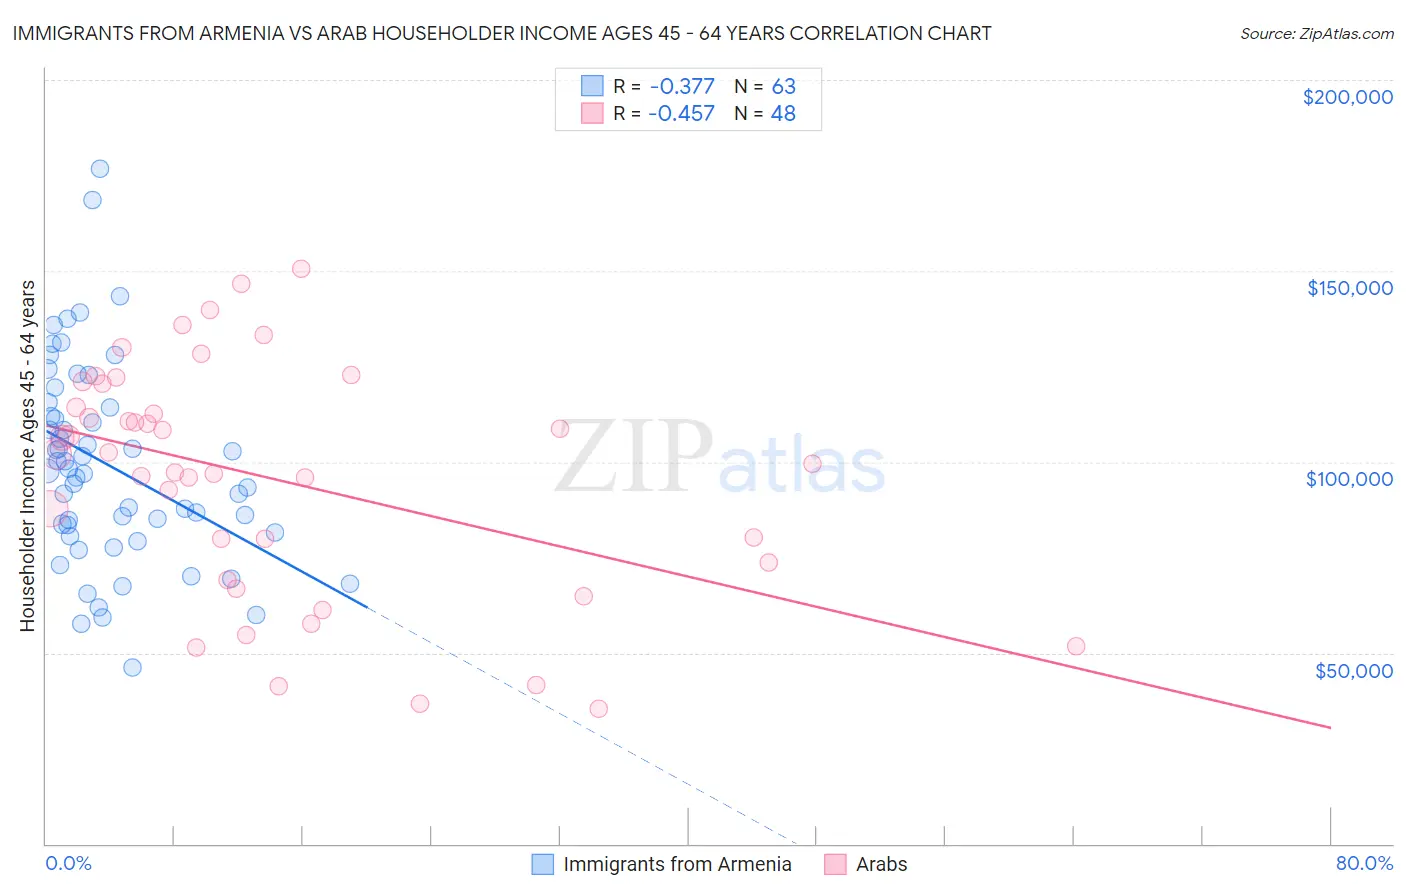
Immigrants from Armenia vs Arab Householder Income Ages 45 - 64 years Correlation Chart

The statistical analysis conducted on geographies consisting of 97,702,858 people shows a mild negative correlation between the proportion of Immigrants from Armenia and household income with householder between the ages 45 and 64 in the United States with a correlation coefficient (R) of -0.377 and weighted average of $94,863. Similarly, the statistical analysis conducted on geographies consisting of 485,614,967 people shows a moderate negative correlation between the proportion of Arabs and household income with householder between the ages 45 and 64 in the United States with a correlation coefficient (R) of -0.457 and weighted average of $104,566, a difference of 10.2%.
Immigrants from Armenia vs Arab Householder Income Ages 45 - 64 years

Householder Income Ages 45 - 64 years Correlation Summary

MeasurementImmigrants from ArmeniaArab
Minimum$46,250$35,250
Maximum$176,833$150,539
Range$130,583$115,289
Mean$99,033$95,530
Median$97,613$100,868
Interquartile 25% (IQ1)$81,563$71,485
Interquartile 75% (IQ3)$114,231$117,419
Interquartile Range (IQR)$32,668$45,934
Standard Deviation (Sample)$26,282$30,403
Standard Deviation (Population)$26,073$30,085

Similar Demographics by Householder Income Ages 45 - 64 years

Demographics Similar to Immigrants from Armenia by Householder Income Ages 45 - 64 years

In terms of householder income ages 45 - 64 years, the demographic groups most similar to Immigrants from Armenia are Salvadoran ($94,842, a difference of 0.020%), Delaware ($94,914, a difference of 0.050%), Immigrants from Nigeria ($94,804, a difference of 0.060%), Immigrants from Ghana ($94,982, a difference of 0.13%), and Malaysian ($94,517, a difference of 0.37%).
DemographicsRating | RankHouseholder Income Ages 45 - 64 years
Venezuelans
12.6
/100
|
#212
Poor
$96,460
Immigrants | Uruguay
10.7
/100
|
#213
Poor
$96,086
Panamanians
10.6
/100
|
#214
Poor
$96,066
Nigerians
8.2
/100
|
#215
Tragic
$95,492
Immigrants | Venezuela
7.6
/100
|
#216
Tragic
$95,342
Immigrants | Ghana
6.4
/100
|
#217
Tragic
$94,982
Delaware
6.2
/100
|
#218
Tragic
$94,914
Immigrants | Armenia
6.1
/100
|
#219
Tragic
$94,863
Salvadorans
6.0
/100
|
#220
Tragic
$94,842
Immigrants | Nigeria
5.9
/100
|
#221
Tragic
$94,804
Malaysians
5.2
/100
|
#222
Tragic
$94,517
Immigrants | Nonimmigrants
5.0
/100
|
#223
Tragic
$94,448
Immigrants | Bosnia and Herzegovina
4.6
/100
|
#224
Tragic
$94,288
Bermudans
4.4
/100
|
#225
Tragic
$94,197
Immigrants | Azores
4.3
/100
|
#226
Tragic
$94,138

Demographics Similar to Arabs by Householder Income Ages 45 - 64 years

In terms of householder income ages 45 - 64 years, the demographic groups most similar to Arabs are Canadian ($104,560, a difference of 0.010%), Brazilian ($104,408, a difference of 0.15%), Lebanese ($104,734, a difference of 0.16%), Immigrants from Syria ($104,858, a difference of 0.28%), and Taiwanese ($104,180, a difference of 0.37%).
DemographicsRating | RankHouseholder Income Ages 45 - 64 years
Portuguese
92.4
/100
|
#126
Exceptional
$105,309
Immigrants | Saudi Arabia
92.2
/100
|
#127
Exceptional
$105,249
Native Hawaiians
91.8
/100
|
#128
Exceptional
$105,149
Peruvians
91.5
/100
|
#129
Exceptional
$105,070
Immigrants | Zimbabwe
91.2
/100
|
#130
Exceptional
$104,992
Immigrants | Syria
90.7
/100
|
#131
Exceptional
$104,858
Lebanese
90.1
/100
|
#132
Exceptional
$104,734
Arabs
89.3
/100
|
#133
Excellent
$104,566
Canadians
89.3
/100
|
#134
Excellent
$104,560
Brazilians
88.6
/100
|
#135
Excellent
$104,408
Taiwanese
87.4
/100
|
#136
Excellent
$104,180
Hungarians
85.8
/100
|
#137
Excellent
$103,913
Ethiopians
84.7
/100
|
#138
Excellent
$103,736
Immigrants | Oceania
84.5
/100
|
#139
Excellent
$103,705
Norwegians
84.3
/100
|
#140
Excellent
$103,682