Immigrants from Argentina vs Albanian Median Family Income
COMPARE
Immigrants from Argentina
Albanian
Median Family Income
Median Family Income Comparison
Immigrants from Argentina
Albanians
$110,873
MEDIAN FAMILY INCOME
98.5/ 100
METRIC RATING
89th/ 347
METRIC RANK
$109,136
MEDIAN FAMILY INCOME
96.4/ 100
METRIC RATING
106th/ 347
METRIC RANK
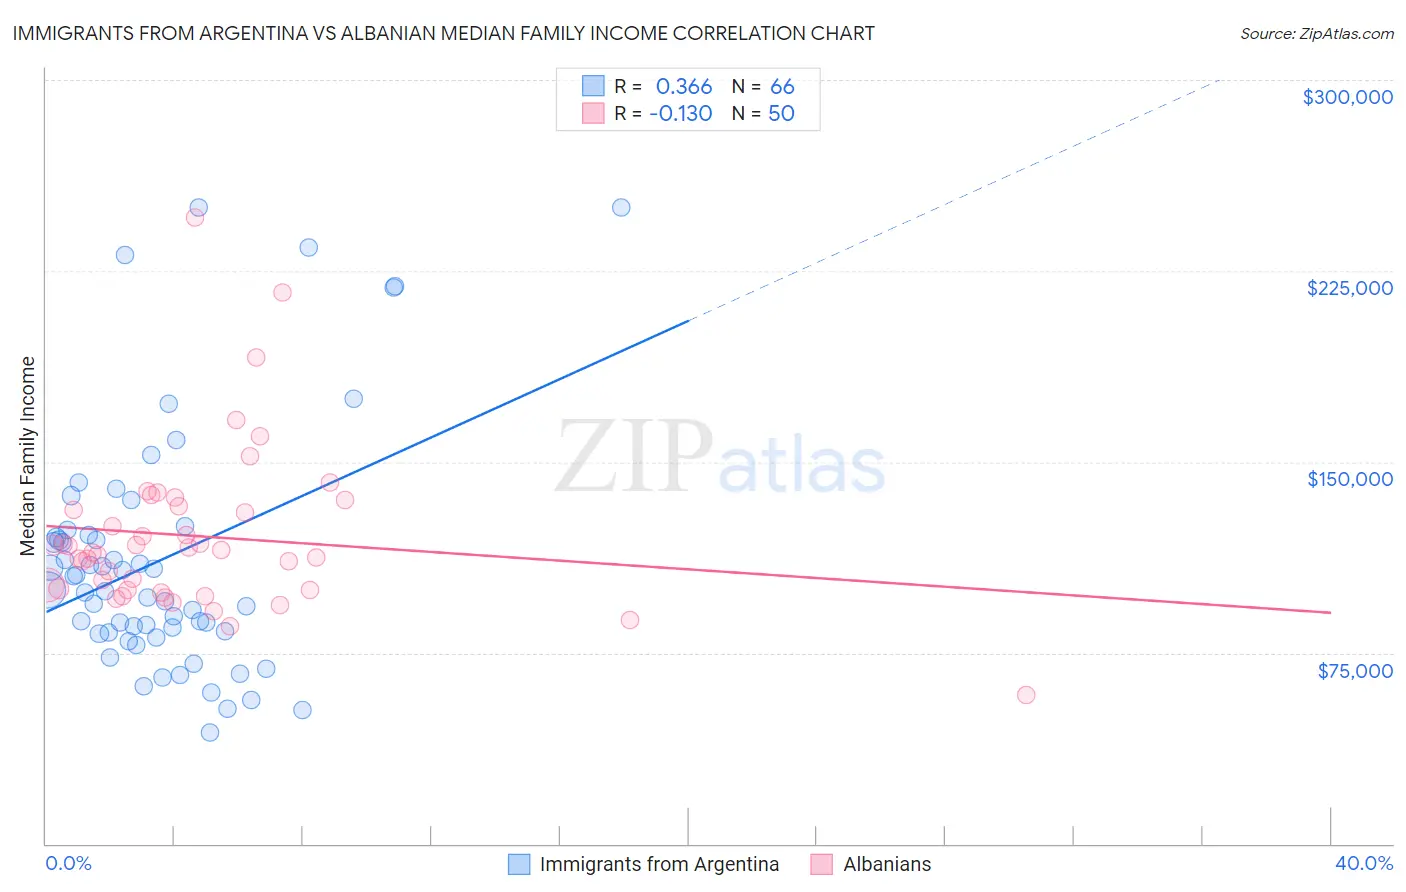
Immigrants from Argentina vs Albanian Median Family Income Correlation Chart
The statistical analysis conducted on geographies consisting of 264,326,105 people shows a mild positive correlation between the proportion of Immigrants from Argentina and median family income in the United States with a correlation coefficient (R) of 0.366 and weighted average of $110,873. Similarly, the statistical analysis conducted on geographies consisting of 193,155,793 people shows a poor negative correlation between the proportion of Albanians and median family income in the United States with a correlation coefficient (R) of -0.130 and weighted average of $109,136, a difference of 1.6%.
Median Family Income Correlation Summary
| Measurement | Immigrants from Argentina | Albanian |
| Minimum | $43,750 | $58,625 |
| Maximum | $250,001 | $246,215 |
| Range | $206,251 | $187,590 |
| Mean | $111,446 | $120,773 |
| Median | $99,402 | $114,864 |
| Interquartile 25% (IQ1) | $83,128 | $99,531 |
| Interquartile 75% (IQ3) | $121,234 | $132,647 |
| Interquartile Range (IQR) | $38,106 | $33,116 |
| Standard Deviation (Sample) | $47,916 | $32,208 |
| Standard Deviation (Population) | $47,552 | $31,885 |
Demographics Similar to Immigrants from Argentina and Albanians by Median Family Income
In terms of median family income, the demographic groups most similar to Immigrants from Argentina are Northern European ($110,635, a difference of 0.21%), Immigrants from Southern Europe ($110,614, a difference of 0.23%), Romanian ($111,243, a difference of 0.33%), Austrian ($111,306, a difference of 0.39%), and Immigrants from Lebanon ($110,159, a difference of 0.65%). Similarly, the demographic groups most similar to Albanians are Immigrants from North Macedonia ($109,136, a difference of 0.0%), Syrian ($109,299, a difference of 0.15%), Palestinian ($109,413, a difference of 0.25%), Immigrants from Brazil ($109,418, a difference of 0.26%), and Assyrian/Chaldean/Syriac ($109,622, a difference of 0.45%).
| Demographics | Rating | Rank | Median Family Income |
| Austrians | 98.8 /100 | #87 | Exceptional $111,306 |
| Romanians | 98.8 /100 | #88 | Exceptional $111,243 |
| Immigrants | Argentina | 98.5 /100 | #89 | Exceptional $110,873 |
| Northern Europeans | 98.3 /100 | #90 | Exceptional $110,635 |
| Immigrants | Southern Europe | 98.3 /100 | #91 | Exceptional $110,614 |
| Immigrants | Lebanon | 97.9 /100 | #92 | Exceptional $110,159 |
| Immigrants | Kazakhstan | 97.8 /100 | #93 | Exceptional $110,137 |
| Koreans | 97.8 /100 | #94 | Exceptional $110,103 |
| Zimbabweans | 97.7 /100 | #95 | Exceptional $110,011 |
| Immigrants | Moldova | 97.7 /100 | #96 | Exceptional $109,975 |
| Jordanians | 97.5 /100 | #97 | Exceptional $109,865 |
| Immigrants | Kuwait | 97.4 /100 | #98 | Exceptional $109,731 |
| Armenians | 97.3 /100 | #99 | Exceptional $109,692 |
| Macedonians | 97.3 /100 | #100 | Exceptional $109,668 |
| Immigrants | Ukraine | 97.2 /100 | #101 | Exceptional $109,645 |
| Assyrians/Chaldeans/Syriacs | 97.2 /100 | #102 | Exceptional $109,622 |
| Immigrants | Brazil | 96.9 /100 | #103 | Exceptional $109,418 |
| Palestinians | 96.9 /100 | #104 | Exceptional $109,413 |
| Syrians | 96.7 /100 | #105 | Exceptional $109,299 |
| Albanians | 96.4 /100 | #106 | Exceptional $109,136 |
| Immigrants | North Macedonia | 96.4 /100 | #107 | Exceptional $109,136 |