Immigrants from Albania vs Syrian Per Capita Income
COMPARE
Immigrants from Albania
Syrian
Per Capita Income
Per Capita Income Comparison
Immigrants from Albania
Syrians
$46,387
PER CAPITA INCOME
95.5/ 100
METRIC RATING
113th/ 347
METRIC RANK
$46,837
PER CAPITA INCOME
97.2/ 100
METRIC RATING
103rd/ 347
METRIC RANK
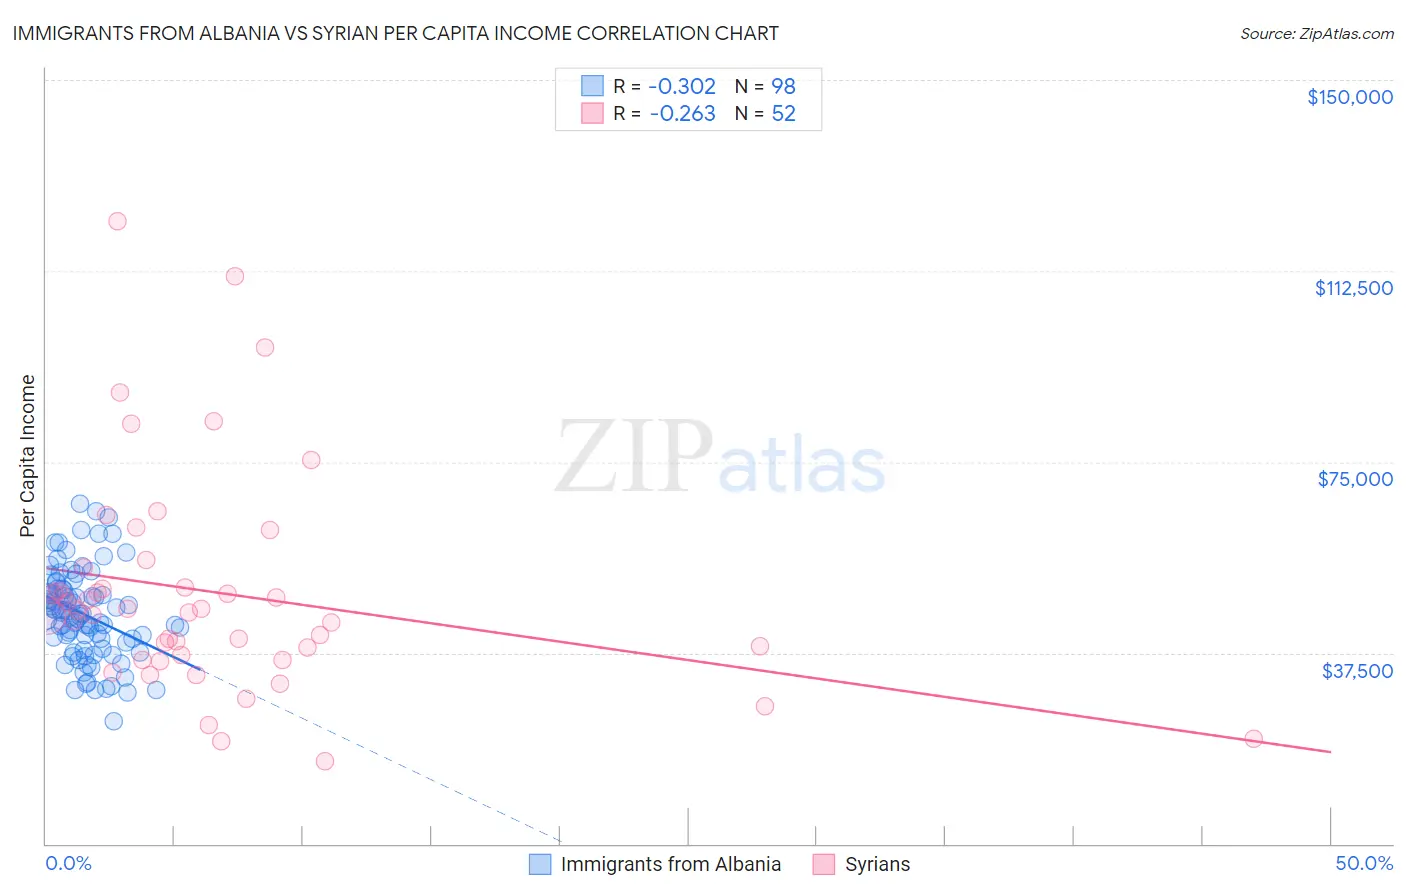
Immigrants from Albania vs Syrian Per Capita Income Correlation Chart
The statistical analysis conducted on geographies consisting of 119,376,608 people shows a mild negative correlation between the proportion of Immigrants from Albania and per capita income in the United States with a correlation coefficient (R) of -0.302 and weighted average of $46,387. Similarly, the statistical analysis conducted on geographies consisting of 266,332,251 people shows a weak negative correlation between the proportion of Syrians and per capita income in the United States with a correlation coefficient (R) of -0.263 and weighted average of $46,837, a difference of 0.97%.
Per Capita Income Correlation Summary
| Measurement | Immigrants from Albania | Syrian |
| Minimum | $24,123 | $16,296 |
| Maximum | $66,738 | $122,379 |
| Range | $42,615 | $106,083 |
| Mean | $45,029 | $49,326 |
| Median | $45,153 | $45,708 |
| Interquartile 25% (IQ1) | $39,496 | $36,580 |
| Interquartile 75% (IQ3) | $49,916 | $52,298 |
| Interquartile Range (IQR) | $10,420 | $15,717 |
| Standard Deviation (Sample) | $8,753 | $21,603 |
| Standard Deviation (Population) | $8,708 | $21,394 |
Demographics Similar to Immigrants from Albania and Syrians by Per Capita Income
In terms of per capita income, the demographic groups most similar to Immigrants from Albania are Immigrants from Morocco ($46,430, a difference of 0.090%), Taiwanese ($46,455, a difference of 0.14%), Chilean ($46,459, a difference of 0.15%), Afghan ($46,268, a difference of 0.26%), and Immigrants from Northern Africa ($46,531, a difference of 0.31%). Similarly, the demographic groups most similar to Syrians are Immigrants from Western Asia ($46,876, a difference of 0.080%), Immigrants from Uzbekistan ($46,929, a difference of 0.20%), Immigrants from Lebanon ($46,938, a difference of 0.22%), Brazilian ($46,700, a difference of 0.29%), and Laotian ($47,041, a difference of 0.43%).
| Demographics | Rating | Rank | Per Capita Income |
| Immigrants | Pakistan | 97.9 /100 | #98 | Exceptional $47,084 |
| Laotians | 97.8 /100 | #99 | Exceptional $47,041 |
| Immigrants | Lebanon | 97.5 /100 | #100 | Exceptional $46,938 |
| Immigrants | Uzbekistan | 97.5 /100 | #101 | Exceptional $46,929 |
| Immigrants | Western Asia | 97.4 /100 | #102 | Exceptional $46,876 |
| Syrians | 97.2 /100 | #103 | Exceptional $46,837 |
| Brazilians | 96.8 /100 | #104 | Exceptional $46,700 |
| British | 96.3 /100 | #105 | Exceptional $46,571 |
| Ethiopians | 96.3 /100 | #106 | Exceptional $46,569 |
| Serbians | 96.2 /100 | #107 | Exceptional $46,551 |
| Immigrants | Kuwait | 96.2 /100 | #108 | Exceptional $46,543 |
| Immigrants | Northern Africa | 96.2 /100 | #109 | Exceptional $46,531 |
| Chileans | 95.9 /100 | #110 | Exceptional $46,459 |
| Taiwanese | 95.8 /100 | #111 | Exceptional $46,455 |
| Immigrants | Morocco | 95.7 /100 | #112 | Exceptional $46,430 |
| Immigrants | Albania | 95.5 /100 | #113 | Exceptional $46,387 |
| Afghans | 94.9 /100 | #114 | Exceptional $46,268 |
| Immigrants | Chile | 94.6 /100 | #115 | Exceptional $46,213 |
| Poles | 94.1 /100 | #116 | Exceptional $46,123 |
| Chinese | 93.9 /100 | #117 | Exceptional $46,098 |
| Immigrants | Saudi Arabia | 93.3 /100 | #118 | Exceptional $46,008 |