Immigrants from Albania vs Pennsylvania German Median Earnings
COMPARE
Immigrants from Albania
Pennsylvania German
Median Earnings
Median Earnings Comparison
Immigrants from Albania
Pennsylvania Germans
$49,377
MEDIAN EARNINGS
98.4/ 100
METRIC RATING
106th/ 347
METRIC RANK
$42,615
MEDIAN EARNINGS
0.5/ 100
METRIC RATING
271st/ 347
METRIC RANK
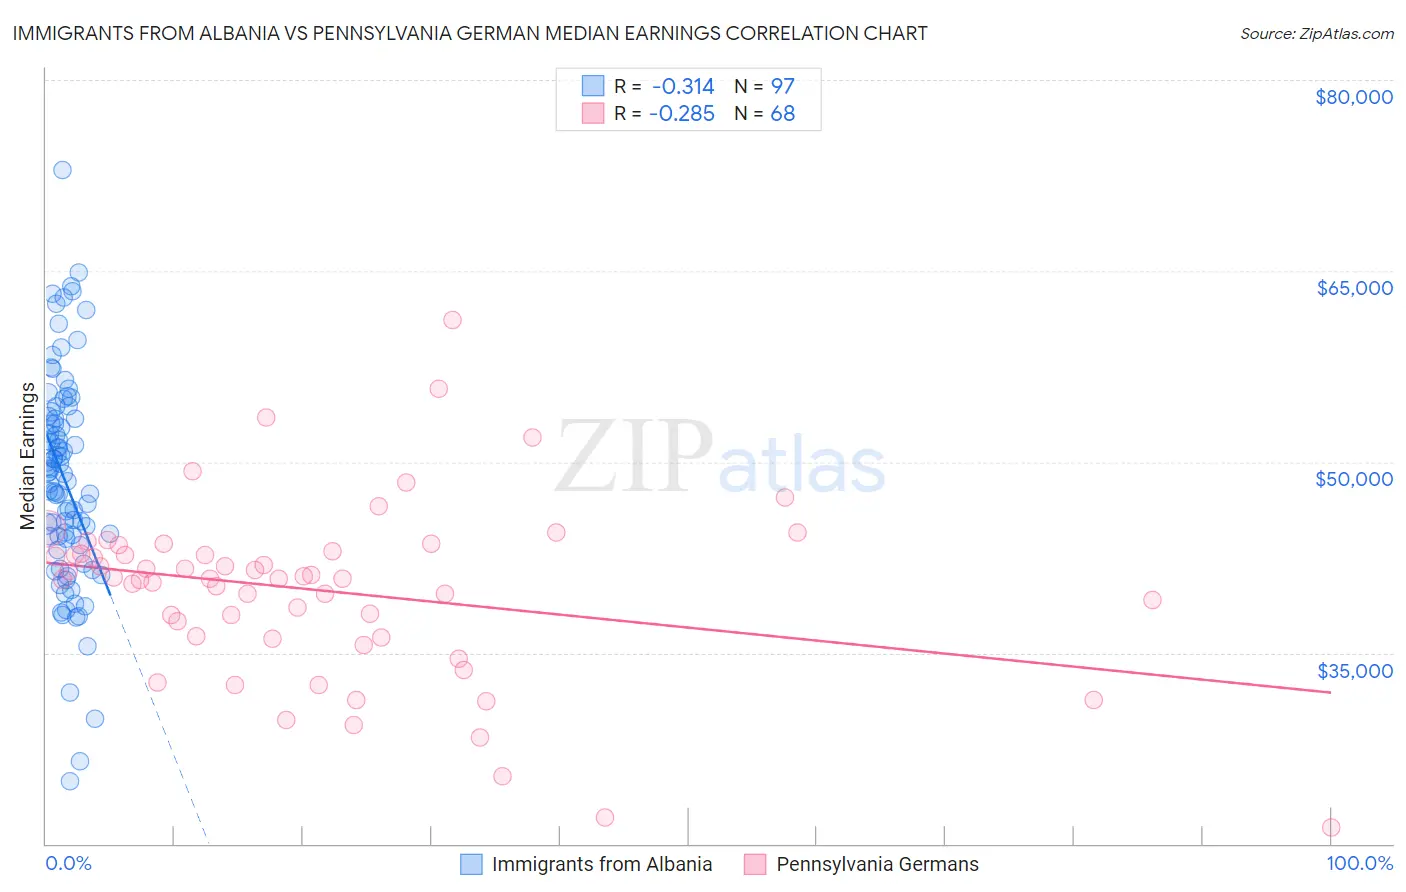
Immigrants from Albania vs Pennsylvania German Median Earnings Correlation Chart
The statistical analysis conducted on geographies consisting of 119,374,526 people shows a mild negative correlation between the proportion of Immigrants from Albania and median earnings in the United States with a correlation coefficient (R) of -0.314 and weighted average of $49,377. Similarly, the statistical analysis conducted on geographies consisting of 234,087,071 people shows a weak negative correlation between the proportion of Pennsylvania Germans and median earnings in the United States with a correlation coefficient (R) of -0.285 and weighted average of $42,615, a difference of 15.9%.
Median Earnings Correlation Summary
| Measurement | Immigrants from Albania | Pennsylvania German |
| Minimum | $24,914 | $21,250 |
| Maximum | $72,899 | $61,146 |
| Range | $47,985 | $39,896 |
| Mean | $48,556 | $39,881 |
| Median | $49,058 | $40,836 |
| Interquartile 25% (IQ1) | $43,717 | $36,214 |
| Interquartile 75% (IQ3) | $53,495 | $42,893 |
| Interquartile Range (IQR) | $9,778 | $6,679 |
| Standard Deviation (Sample) | $8,407 | $6,983 |
| Standard Deviation (Population) | $8,364 | $6,932 |
Similar Demographics by Median Earnings
Demographics Similar to Immigrants from Albania by Median Earnings
In terms of median earnings, the demographic groups most similar to Immigrants from Albania are Immigrants from Western Asia ($49,389, a difference of 0.020%), Immigrants from Morocco ($49,368, a difference of 0.020%), Immigrants from Brazil ($49,463, a difference of 0.17%), Austrian ($49,501, a difference of 0.25%), and Palestinian ($49,209, a difference of 0.34%).
| Demographics | Rating | Rank | Median Earnings |
| Immigrants | Afghanistan | 98.9 /100 | #99 | Exceptional $49,645 |
| Immigrants | Poland | 98.9 /100 | #100 | Exceptional $49,633 |
| Jordanians | 98.9 /100 | #101 | Exceptional $49,632 |
| Ethiopians | 98.8 /100 | #102 | Exceptional $49,572 |
| Austrians | 98.7 /100 | #103 | Exceptional $49,501 |
| Immigrants | Brazil | 98.6 /100 | #104 | Exceptional $49,463 |
| Immigrants | Western Asia | 98.4 /100 | #105 | Exceptional $49,389 |
| Immigrants | Albania | 98.4 /100 | #106 | Exceptional $49,377 |
| Immigrants | Morocco | 98.4 /100 | #107 | Exceptional $49,368 |
| Palestinians | 98.0 /100 | #108 | Exceptional $49,209 |
| Syrians | 97.1 /100 | #109 | Exceptional $48,934 |
| Immigrants | Ethiopia | 97.1 /100 | #110 | Exceptional $48,924 |
| Immigrants | Zimbabwe | 97.0 /100 | #111 | Exceptional $48,913 |
| Northern Europeans | 96.9 /100 | #112 | Exceptional $48,887 |
| Immigrants | Kuwait | 96.8 /100 | #113 | Exceptional $48,861 |
Demographics Similar to Pennsylvania Germans by Median Earnings
In terms of median earnings, the demographic groups most similar to Pennsylvania Germans are Osage ($42,651, a difference of 0.090%), Belizean ($42,702, a difference of 0.21%), American ($42,742, a difference of 0.30%), Cree ($42,777, a difference of 0.38%), and Iroquois ($42,430, a difference of 0.43%).
| Demographics | Rating | Rank | Median Earnings |
| Immigrants | Liberia | 0.7 /100 | #264 | Tragic $42,923 |
| Salvadorans | 0.7 /100 | #265 | Tragic $42,912 |
| Immigrants | Laos | 0.7 /100 | #266 | Tragic $42,884 |
| Cree | 0.6 /100 | #267 | Tragic $42,777 |
| Americans | 0.6 /100 | #268 | Tragic $42,742 |
| Belizeans | 0.5 /100 | #269 | Tragic $42,702 |
| Osage | 0.5 /100 | #270 | Tragic $42,651 |
| Pennsylvania Germans | 0.5 /100 | #271 | Tragic $42,615 |
| Iroquois | 0.4 /100 | #272 | Tragic $42,430 |
| Immigrants | Dominica | 0.4 /100 | #273 | Tragic $42,420 |
| Immigrants | El Salvador | 0.4 /100 | #274 | Tragic $42,413 |
| Immigrants | Belize | 0.3 /100 | #275 | Tragic $42,339 |
| Spanish Americans | 0.3 /100 | #276 | Tragic $42,316 |
| Central Americans | 0.3 /100 | #277 | Tragic $42,280 |
| Cajuns | 0.3 /100 | #278 | Tragic $42,189 |