Honduran vs Austrian Median Family Income

COMPARE

Honduran
Race
Ancestry
AfghanAfricanAlaska NativeAlaskan AthabascanAlbanianAleutAlsatianAmericanApacheArabArapahoArgentineanArmenianAssyrian/Chaldean/SyriacAustralianBahamianBangladeshiBarbadianBasqueBelgianBelizeanBermudanBhutaneseBlackfeetBolivianBrazilianBritishBritish West IndianBulgarianBurmeseCajunCambodianCanadianCape VerdeanCarpatho RusynCelticCentral AmericanCentral American IndianCherokeeCheyenneChickasawChileanChineseChippewaChoctawColombianColvilleComancheCosta RicanCreeCreekCroatianCrowCubanCypriotCzechCzechoslovakianDanishDelawareDominicanDutchDutch West IndianEastern EuropeanEcuadorianEgyptianEnglishEstonianEthiopianEuropeanFijianFilipinoFinnishFrenchFrench American IndianFrench CanadianGermanGerman RussianGhanaianGreekGuamanian/ChamorroGuatemalanGuyaneseHaitianHmongHonduranHopiHoumaHungarianIcelanderIndian (Asian)IndonesianInupiatIranianIraqiIrishIroquoisIsraeliItalianJamaicanJapaneseJordanianKenyanKiowaKoreanLaotianLatvianLebaneseLiberianLithuanianLumbeeLuxembourgerMacedonianMalaysianMalteseMarshalleseMenomineeMexicanMexican American IndianMongolianMoroccanNative HawaiianNavajoNepaleseNew ZealanderNicaraguanNigerianNorthern EuropeanNorwegianOkinawanOsageOttawaPaiutePakistaniPalestinianPanamanianParaguayanPennsylvania GermanPeruvianPimaPolishPortuguesePotawatomiPuebloPuerto RicanPuget Sound SalishRomanianRussianSalvadoranSamoanScandinavianScotch-IrishScottishSeminoleSenegaleseSerbianShoshoneSierra LeoneanSiouxSlavicSlovakSloveneSomaliSouth AfricanSouth AmericanSouth American IndianSoviet UnionSpaniardSpanishSpanish AmericanSpanish American IndianSri LankanSubsaharan AfricanSudaneseSwedishSwissSyrianTaiwaneseThaiTlingit-HaidaTohono O'OdhamTonganTrinidadian and TobagonianTsimshianTurkishU.S. Virgin IslanderUgandanUkrainianUruguayanUteVenezuelanVietnameseWelshWest IndianYakamaYaquiYugoslavianYumanYup'ikZimbabwean
Immigration
NonimmigrantsImmigrantsAfghanistanAfricaAlbaniaArgentinaArmeniaAsiaAustraliaAustriaBahamasBangladeshBarbadosBelarusBelgiumBelizeBoliviaBosnia and HerzegovinaBrazilBulgariaBurma/MyanmarCabo VerdeCambodiaCameroonCanadaCaribbeanCentral AmericaChileChinaColombiaCongoCosta RicaCroatiaCubaCzechoslovakiaDenmarkDominicaDominican RepublicEastern AfricaEastern AsiaEastern EuropeEcuadorEgyptEl SalvadorEnglandEritreaEthiopiaEuropeFijiFranceGermanyGhanaGreeceGrenadaGuatemalaGuyanaHaitiHondurasHong KongHungaryIndiaIndonesiaIranIraqIrelandIsraelItalyJamaicaJapanJordanKazakhstanKenyaKoreaKuwaitLaosLatin AmericaLatviaLebanonLiberiaLithuaniaMalaysiaMexicoMicronesiaMiddle AfricaMoldovaMoroccoNepalNetherlandsNicaraguaNigeriaNorth AmericaNorth MacedoniaNorthern AfricaNorthern EuropeNorwayOceaniaPakistanPanamaPeruPhilippinesPolandPortugalRomaniaRussiaSaudi ArabiaScotlandSenegalSerbiaSierra LeoneSingaporeSomaliaSouth AfricaSouth AmericaSouth Central AsiaSouth Eastern AsiaSouthern EuropeSpainSri LankaSt. Vincent and the GrenadinesSudanSwedenSwitzerlandSyriaTaiwanThailandTrinidad and TobagoTurkeyUgandaUkraineUruguayUzbekistanVenezuelaVietnamWest IndiesWestern AfricaWestern AsiaWestern EuropeYemenZaireZimbabweAzores
Austrian
Race
Ancestry
AfghanAfricanAlaska NativeAlaskan AthabascanAlbanianAleutAlsatianAmericanApacheArabArapahoArgentineanArmenianAssyrian/Chaldean/SyriacAustralianAustrianBahamianBangladeshiBarbadianBasqueBelgianBelizeanBermudanBhutaneseBlackfeetBolivianBrazilianBritishBritish West IndianBulgarianBurmeseCajunCambodianCanadianCape VerdeanCarpatho RusynCelticCentral AmericanCentral American IndianCherokeeCheyenneChickasawChileanChineseChippewaChoctawColombianColvilleComancheCosta RicanCreeCreekCroatianCrowCubanCypriotCzechCzechoslovakianDanishDelawareDominicanDutchDutch West IndianEastern EuropeanEcuadorianEgyptianEnglishEstonianEthiopianEuropeanFijianFilipinoFinnishFrenchFrench American IndianFrench CanadianGermanGerman RussianGhanaianGreekGuamanian/ChamorroGuatemalanGuyaneseHaitianHmongHopiHoumaHungarianIcelanderIndian (Asian)IndonesianInupiatIranianIraqiIrishIroquoisIsraeliItalianJamaicanJapaneseJordanianKenyanKiowaKoreanLaotianLatvianLebaneseLiberianLithuanianLumbeeLuxembourgerMacedonianMalaysianMalteseMarshalleseMenomineeMexicanMexican American IndianMongolianMoroccanNative HawaiianNavajoNepaleseNew ZealanderNicaraguanNigerianNorthern EuropeanNorwegianOkinawanOsageOttawaPaiutePakistaniPalestinianPanamanianParaguayanPennsylvania GermanPeruvianPimaPolishPortuguesePotawatomiPuebloPuerto RicanPuget Sound SalishRomanianRussianSalvadoranSamoanScandinavianScotch-IrishScottishSeminoleSenegaleseSerbianShoshoneSierra LeoneanSiouxSlavicSlovakSloveneSomaliSouth AfricanSouth AmericanSouth American IndianSoviet UnionSpaniardSpanishSpanish AmericanSpanish American IndianSri LankanSubsaharan AfricanSudaneseSwedishSwissSyrianTaiwaneseThaiTlingit-HaidaTohono O'OdhamTonganTrinidadian and TobagonianTsimshianTurkishU.S. Virgin IslanderUgandanUkrainianUruguayanUteVenezuelanVietnameseWelshWest IndianYakamaYaquiYugoslavianYumanYup'ikZimbabwean
Immigration
NonimmigrantsImmigrantsAfghanistanAfricaAlbaniaArgentinaArmeniaAsiaAustraliaAustriaBahamasBangladeshBarbadosBelarusBelgiumBelizeBoliviaBosnia and HerzegovinaBrazilBulgariaBurma/MyanmarCabo VerdeCambodiaCameroonCanadaCaribbeanCentral AmericaChileChinaColombiaCongoCosta RicaCroatiaCubaCzechoslovakiaDenmarkDominicaDominican RepublicEastern AfricaEastern AsiaEastern EuropeEcuadorEgyptEl SalvadorEnglandEritreaEthiopiaEuropeFijiFranceGermanyGhanaGreeceGrenadaGuatemalaGuyanaHaitiHondurasHong KongHungaryIndiaIndonesiaIranIraqIrelandIsraelItalyJamaicaJapanJordanKazakhstanKenyaKoreaKuwaitLaosLatin AmericaLatviaLebanonLiberiaLithuaniaMalaysiaMexicoMicronesiaMiddle AfricaMoldovaMoroccoNepalNetherlandsNicaraguaNigeriaNorth AmericaNorth MacedoniaNorthern AfricaNorthern EuropeNorwayOceaniaPakistanPanamaPeruPhilippinesPolandPortugalRomaniaRussiaSaudi ArabiaScotlandSenegalSerbiaSierra LeoneSingaporeSomaliaSouth AfricaSouth AmericaSouth Central AsiaSouth Eastern AsiaSouthern EuropeSpainSri LankaSt. Vincent and the GrenadinesSudanSwedenSwitzerlandSyriaTaiwanThailandTrinidad and TobagoTurkeyUgandaUkraineUruguayUzbekistanVenezuelaVietnamWest IndiesWestern AfricaWestern AsiaWestern EuropeYemenZaireZimbabweAzores
Median Family Income
Income
Poverty
Unemployment
Labor Participation
Family Structure
Vehicle Availability
Education Level
Disability

Median Family Income Comparison

Hondurans

Austrians

Tragic
Exceptional
$85,004
MEDIAN FAMILY INCOME
0.0/ 100
METRIC RATING
311th/ 347
METRIC RANK
$111,306
MEDIAN FAMILY INCOME
98.8/ 100
METRIC RATING
87th/ 347
METRIC RANK

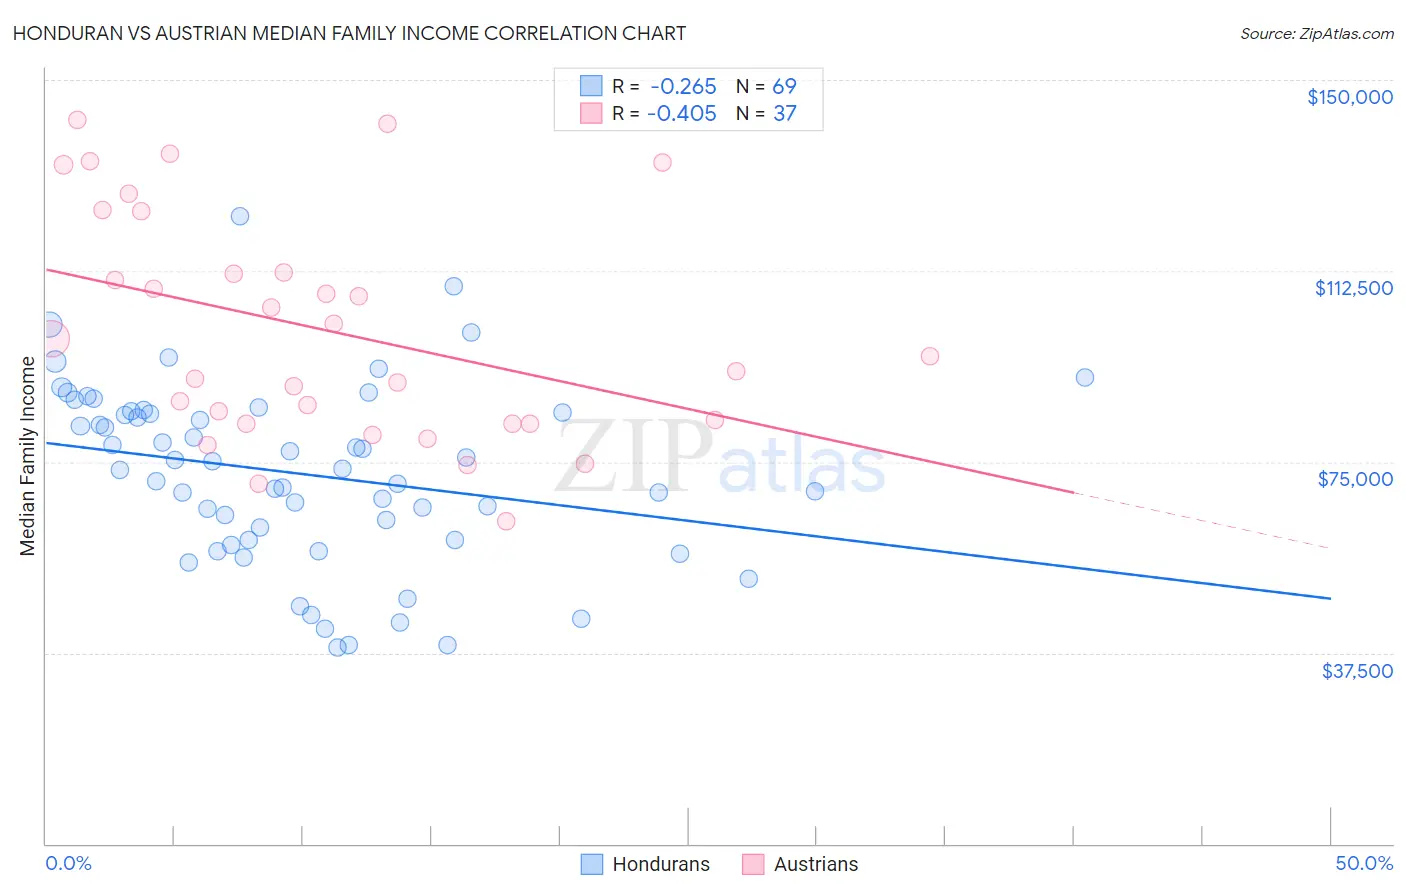
Honduran vs Austrian Median Family Income Correlation Chart

The statistical analysis conducted on geographies consisting of 357,506,155 people shows a weak negative correlation between the proportion of Hondurans and median family income in the United States with a correlation coefficient (R) of -0.265 and weighted average of $85,004. Similarly, the statistical analysis conducted on geographies consisting of 451,614,723 people shows a moderate negative correlation between the proportion of Austrians and median family income in the United States with a correlation coefficient (R) of -0.405 and weighted average of $111,306, a difference of 30.9%.
Honduran vs Austrian Median Family Income

Median Family Income Correlation Summary

MeasurementHonduranAustrian
Minimum$38,552$63,235
Maximum$123,311$142,142
Range$84,759$78,907
Mean$72,692$100,879
Median$73,540$95,625
Interquartile 25% (IQ1)$59,714$82,447
Interquartile 75% (IQ3)$84,854$118,182
Interquartile Range (IQR)$25,140$35,735
Standard Deviation (Sample)$17,679$22,141
Standard Deviation (Population)$17,550$21,840

Similar Demographics by Median Family Income

Demographics Similar to Hondurans by Median Family Income

In terms of median family income, the demographic groups most similar to Hondurans are Cuban ($84,981, a difference of 0.030%), Immigrants from Central America ($85,050, a difference of 0.050%), Choctaw ($84,835, a difference of 0.20%), Haitian ($85,218, a difference of 0.25%), and Immigrants from Bahamas ($84,732, a difference of 0.32%).
DemographicsRating | RankMedian Family Income
Mexicans
0.0
/100
|
#304
Tragic
$85,618
Paiute
0.0
/100
|
#305
Tragic
$85,414
Immigrants | Dominica
0.0
/100
|
#306
Tragic
$85,411
Chickasaw
0.0
/100
|
#307
Tragic
$85,356
U.S. Virgin Islanders
0.0
/100
|
#308
Tragic
$85,294
Haitians
0.0
/100
|
#309
Tragic
$85,218
Immigrants | Central America
0.0
/100
|
#310
Tragic
$85,050
Hondurans
0.0
/100
|
#311
Tragic
$85,004
Cubans
0.0
/100
|
#312
Tragic
$84,981
Choctaw
0.0
/100
|
#313
Tragic
$84,835
Immigrants | Bahamas
0.0
/100
|
#314
Tragic
$84,732
Apache
0.0
/100
|
#315
Tragic
$84,451
Immigrants | Haiti
0.0
/100
|
#316
Tragic
$84,018
Yakama
0.0
/100
|
#317
Tragic
$83,932
Immigrants | Mexico
0.0
/100
|
#318
Tragic
$83,639

Demographics Similar to Austrians by Median Family Income

In terms of median family income, the demographic groups most similar to Austrians are Immigrants from Hungary ($111,378, a difference of 0.060%), Croatian ($111,370, a difference of 0.060%), Ukrainian ($111,368, a difference of 0.060%), Romanian ($111,243, a difference of 0.060%), and Immigrants from Egypt ($111,689, a difference of 0.34%).
DemographicsRating | RankMedian Family Income
Immigrants | Croatia
99.3
/100
|
#80
Exceptional
$112,323
Immigrants | North America
99.2
/100
|
#81
Exceptional
$112,151
Immigrants | England
99.2
/100
|
#82
Exceptional
$112,038
Immigrants | Egypt
99.0
/100
|
#83
Exceptional
$111,689
Immigrants | Hungary
98.8
/100
|
#84
Exceptional
$111,378
Croatians
98.8
/100
|
#85
Exceptional
$111,370
Ukrainians
98.8
/100
|
#86
Exceptional
$111,368
Austrians
98.8
/100
|
#87
Exceptional
$111,306
Romanians
98.8
/100
|
#88
Exceptional
$111,243
Immigrants | Argentina
98.5
/100
|
#89
Exceptional
$110,873
Northern Europeans
98.3
/100
|
#90
Exceptional
$110,635
Immigrants | Southern Europe
98.3
/100
|
#91
Exceptional
$110,614
Immigrants | Lebanon
97.9
/100
|
#92
Exceptional
$110,159
Immigrants | Kazakhstan
97.8
/100
|
#93
Exceptional
$110,137
Koreans
97.8
/100
|
#94
Exceptional
$110,103