Hmong vs Cypriot Per Capita Income
COMPARE
Hmong
Cypriot
Per Capita Income
Per Capita Income Comparison
Hmong
Cypriots
$38,120
PER CAPITA INCOME
0.2/ 100
METRIC RATING
276th/ 347
METRIC RANK
$54,899
PER CAPITA INCOME
100.0/ 100
METRIC RATING
15th/ 347
METRIC RANK
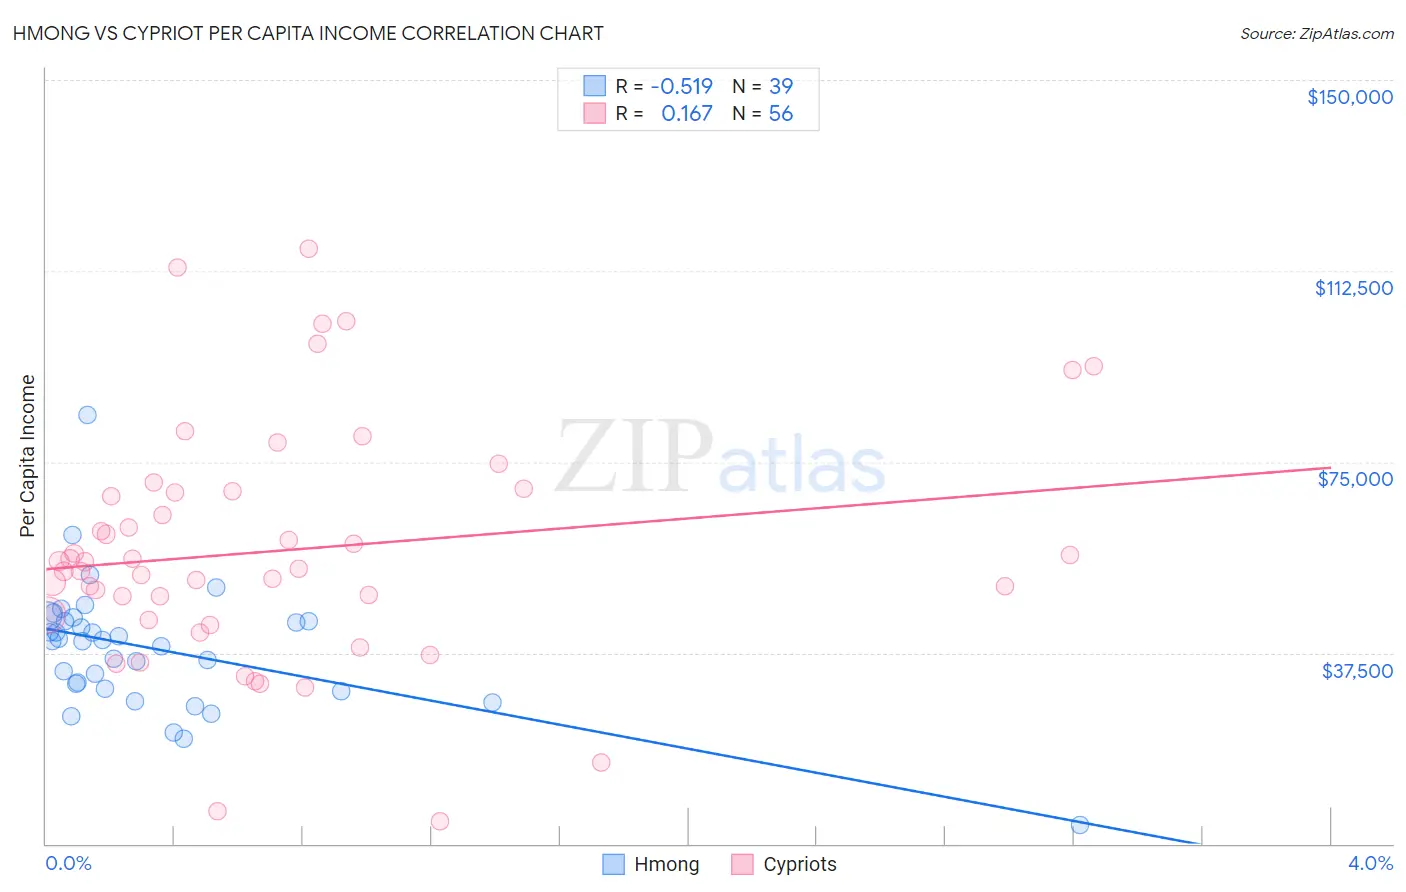
Hmong vs Cypriot Per Capita Income Correlation Chart
The statistical analysis conducted on geographies consisting of 24,672,334 people shows a substantial negative correlation between the proportion of Hmong and per capita income in the United States with a correlation coefficient (R) of -0.519 and weighted average of $38,120. Similarly, the statistical analysis conducted on geographies consisting of 61,866,365 people shows a poor positive correlation between the proportion of Cypriots and per capita income in the United States with a correlation coefficient (R) of 0.167 and weighted average of $54,899, a difference of 44.0%.
Per Capita Income Correlation Summary
| Measurement | Hmong | Cypriot |
| Minimum | $3,563 | $4,509 |
| Maximum | $84,315 | $116,766 |
| Range | $80,752 | $112,257 |
| Mean | $38,244 | $57,593 |
| Median | $39,777 | $54,638 |
| Interquartile 25% (IQ1) | $30,464 | $44,518 |
| Interquartile 75% (IQ3) | $43,732 | $69,117 |
| Interquartile Range (IQR) | $13,268 | $24,599 |
| Standard Deviation (Sample) | $12,703 | $23,513 |
| Standard Deviation (Population) | $12,539 | $23,302 |
Similar Demographics by Per Capita Income
Demographics Similar to Hmong by Per Capita Income
In terms of per capita income, the demographic groups most similar to Hmong are Comanche ($38,088, a difference of 0.080%), Immigrants from Liberia ($38,165, a difference of 0.12%), Immigrants from Nicaragua ($38,065, a difference of 0.15%), Colville ($38,047, a difference of 0.19%), and Potawatomi ($38,046, a difference of 0.20%).
| Demographics | Rating | Rank | Per Capita Income |
| Immigrants | Jamaica | 0.4 /100 | #269 | Tragic $38,766 |
| Immigrants | Belize | 0.3 /100 | #270 | Tragic $38,614 |
| Central Americans | 0.3 /100 | #271 | Tragic $38,560 |
| Immigrants | Cabo Verde | 0.3 /100 | #272 | Tragic $38,540 |
| Nepalese | 0.3 /100 | #273 | Tragic $38,442 |
| Immigrants | El Salvador | 0.3 /100 | #274 | Tragic $38,394 |
| Immigrants | Liberia | 0.2 /100 | #275 | Tragic $38,165 |
| Hmong | 0.2 /100 | #276 | Tragic $38,120 |
| Comanche | 0.2 /100 | #277 | Tragic $38,088 |
| Immigrants | Nicaragua | 0.2 /100 | #278 | Tragic $38,065 |
| Colville | 0.2 /100 | #279 | Tragic $38,047 |
| Potawatomi | 0.2 /100 | #280 | Tragic $38,046 |
| Immigrants | Dominica | 0.2 /100 | #281 | Tragic $37,952 |
| Immigrants | Laos | 0.1 /100 | #282 | Tragic $37,857 |
| Pennsylvania Germans | 0.1 /100 | #283 | Tragic $37,842 |
Demographics Similar to Cypriots by Per Capita Income
In terms of per capita income, the demographic groups most similar to Cypriots are Immigrants from Switzerland ($54,866, a difference of 0.060%), Immigrants from Belgium ($55,082, a difference of 0.33%), Immigrants from France ($54,557, a difference of 0.63%), Immigrants from India ($55,268, a difference of 0.67%), and Thai ($54,307, a difference of 1.1%).
| Demographics | Rating | Rank | Per Capita Income |
| Immigrants | Hong Kong | 100.0 /100 | #8 | Exceptional $56,709 |
| Immigrants | Ireland | 100.0 /100 | #9 | Exceptional $56,584 |
| Okinawans | 100.0 /100 | #10 | Exceptional $55,817 |
| Eastern Europeans | 100.0 /100 | #11 | Exceptional $55,780 |
| Immigrants | Sweden | 100.0 /100 | #12 | Exceptional $55,582 |
| Immigrants | India | 100.0 /100 | #13 | Exceptional $55,268 |
| Immigrants | Belgium | 100.0 /100 | #14 | Exceptional $55,082 |
| Cypriots | 100.0 /100 | #15 | Exceptional $54,899 |
| Immigrants | Switzerland | 100.0 /100 | #16 | Exceptional $54,866 |
| Immigrants | France | 100.0 /100 | #17 | Exceptional $54,557 |
| Thais | 100.0 /100 | #18 | Exceptional $54,307 |
| Immigrants | China | 100.0 /100 | #19 | Exceptional $54,264 |
| Soviet Union | 100.0 /100 | #20 | Exceptional $54,202 |
| Immigrants | Northern Europe | 100.0 /100 | #21 | Exceptional $54,159 |
| Indians (Asian) | 100.0 /100 | #22 | Exceptional $53,874 |