Hispanic or Latino vs Afghan Median Male Earnings
COMPARE
Hispanic or Latino
Afghan
Median Male Earnings
Median Male Earnings Comparison
Hispanics or Latinos
Afghans
$46,419
MEDIAN MALE EARNINGS
0.0/ 100
METRIC RATING
312th/ 347
METRIC RANK
$59,554
MEDIAN MALE EARNINGS
99.3/ 100
METRIC RATING
84th/ 347
METRIC RANK
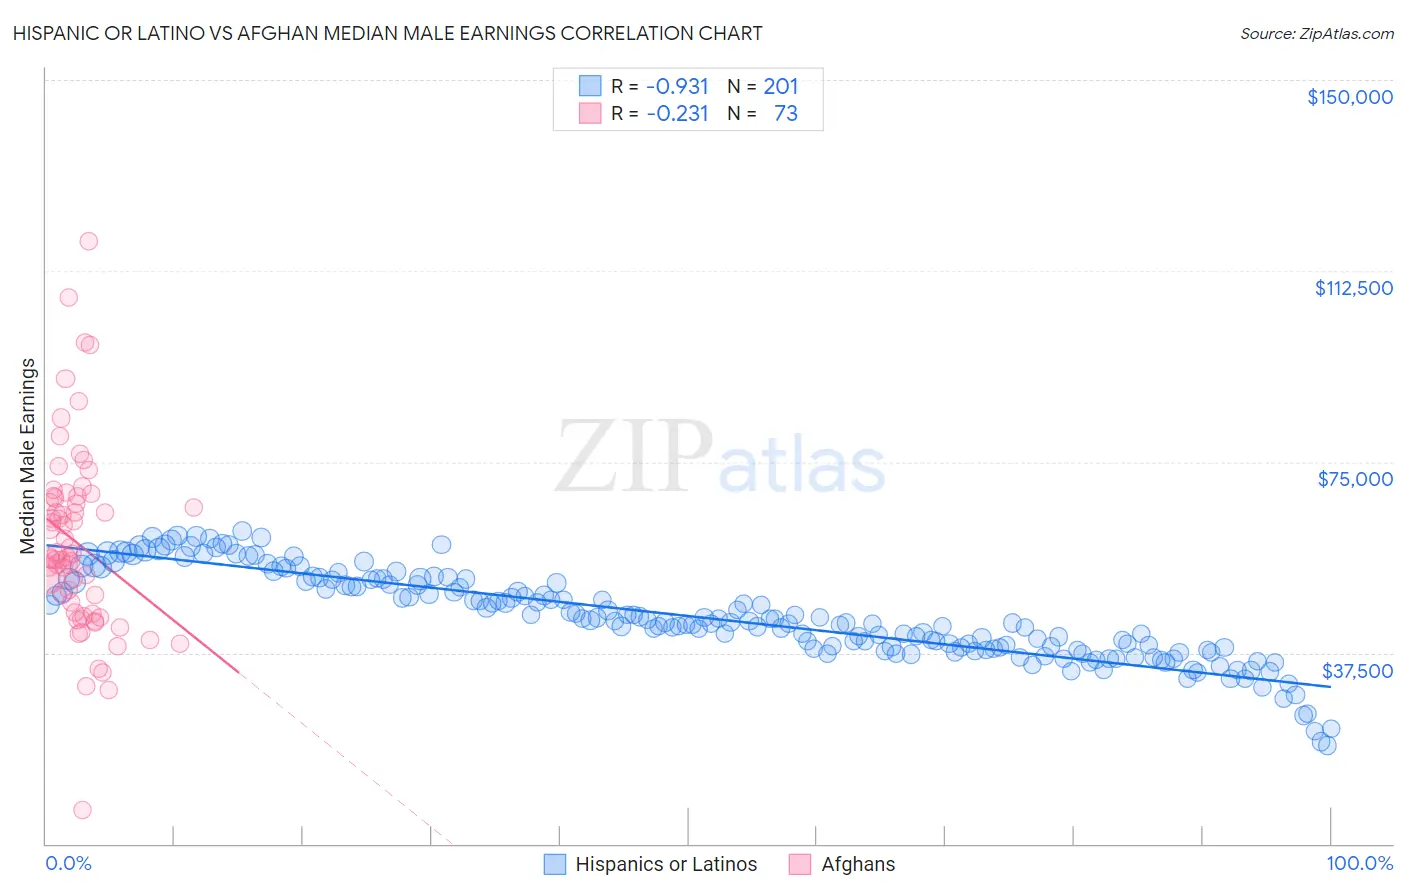
Hispanic or Latino vs Afghan Median Male Earnings Correlation Chart
The statistical analysis conducted on geographies consisting of 577,008,191 people shows a near-perfect negative correlation between the proportion of Hispanics or Latinos and median male earnings in the United States with a correlation coefficient (R) of -0.931 and weighted average of $46,419. Similarly, the statistical analysis conducted on geographies consisting of 148,869,100 people shows a weak negative correlation between the proportion of Afghans and median male earnings in the United States with a correlation coefficient (R) of -0.231 and weighted average of $59,554, a difference of 28.3%.
Median Male Earnings Correlation Summary
| Measurement | Hispanic or Latino | Afghan |
| Minimum | $19,304 | $6,707 |
| Maximum | $61,420 | $118,365 |
| Range | $42,115 | $111,658 |
| Mean | $44,646 | $59,002 |
| Median | $43,909 | $56,261 |
| Interquartile 25% (IQ1) | $38,393 | $45,293 |
| Interquartile 75% (IQ3) | $51,713 | $68,035 |
| Interquartile Range (IQR) | $13,320 | $22,742 |
| Standard Deviation (Sample) | $8,708 | $18,269 |
| Standard Deviation (Population) | $8,686 | $18,144 |
Similar Demographics by Median Male Earnings
Demographics Similar to Hispanics or Latinos by Median Male Earnings
In terms of median male earnings, the demographic groups most similar to Hispanics or Latinos are Apache ($46,429, a difference of 0.020%), Honduran ($46,374, a difference of 0.10%), Chippewa ($46,368, a difference of 0.11%), Cuban ($46,580, a difference of 0.35%), and Creek ($46,594, a difference of 0.38%).
| Demographics | Rating | Rank | Median Male Earnings |
| Guatemalans | 0.0 /100 | #305 | Tragic $46,736 |
| Dutch West Indians | 0.0 /100 | #306 | Tragic $46,656 |
| Immigrants | Dominican Republic | 0.0 /100 | #307 | Tragic $46,655 |
| Ottawa | 0.0 /100 | #308 | Tragic $46,611 |
| Creek | 0.0 /100 | #309 | Tragic $46,594 |
| Cubans | 0.0 /100 | #310 | Tragic $46,580 |
| Apache | 0.0 /100 | #311 | Tragic $46,429 |
| Hispanics or Latinos | 0.0 /100 | #312 | Tragic $46,419 |
| Hondurans | 0.0 /100 | #313 | Tragic $46,374 |
| Chippewa | 0.0 /100 | #314 | Tragic $46,368 |
| Immigrants | Guatemala | 0.0 /100 | #315 | Tragic $46,244 |
| Immigrants | Caribbean | 0.0 /100 | #316 | Tragic $46,193 |
| Mexicans | 0.0 /100 | #317 | Tragic $46,147 |
| Cheyenne | 0.0 /100 | #318 | Tragic $46,062 |
| Haitians | 0.0 /100 | #319 | Tragic $45,903 |
Demographics Similar to Afghans by Median Male Earnings
In terms of median male earnings, the demographic groups most similar to Afghans are Italian ($59,551, a difference of 0.0%), Immigrants from England ($59,527, a difference of 0.050%), Macedonian ($59,522, a difference of 0.050%), Immigrants from Argentina ($59,491, a difference of 0.11%), and Immigrants from Italy ($59,691, a difference of 0.23%).
| Demographics | Rating | Rank | Median Male Earnings |
| Paraguayans | 99.5 /100 | #77 | Exceptional $59,975 |
| Immigrants | Egypt | 99.5 /100 | #78 | Exceptional $59,925 |
| Immigrants | Ukraine | 99.5 /100 | #79 | Exceptional $59,820 |
| Immigrants | Hungary | 99.5 /100 | #80 | Exceptional $59,806 |
| Ukrainians | 99.4 /100 | #81 | Exceptional $59,728 |
| Croatians | 99.4 /100 | #82 | Exceptional $59,715 |
| Immigrants | Italy | 99.4 /100 | #83 | Exceptional $59,691 |
| Afghans | 99.3 /100 | #84 | Exceptional $59,554 |
| Italians | 99.3 /100 | #85 | Exceptional $59,551 |
| Immigrants | England | 99.3 /100 | #86 | Exceptional $59,527 |
| Macedonians | 99.3 /100 | #87 | Exceptional $59,522 |
| Immigrants | Argentina | 99.3 /100 | #88 | Exceptional $59,491 |
| Immigrants | Moldova | 99.2 /100 | #89 | Exceptional $59,417 |
| Austrians | 99.2 /100 | #90 | Exceptional $59,359 |
| Laotians | 99.2 /100 | #91 | Exceptional $59,351 |