Haitian vs Immigrants from Afghanistan Median Female Earnings
COMPARE
Haitian
Immigrants from Afghanistan
Median Female Earnings
Median Female Earnings Comparison
Haitians
Immigrants from Afghanistan
$36,374
MEDIAN FEMALE EARNINGS
0.1/ 100
METRIC RATING
282nd/ 347
METRIC RANK
$42,055
MEDIAN FEMALE EARNINGS
99.3/ 100
METRIC RATING
89th/ 347
METRIC RANK
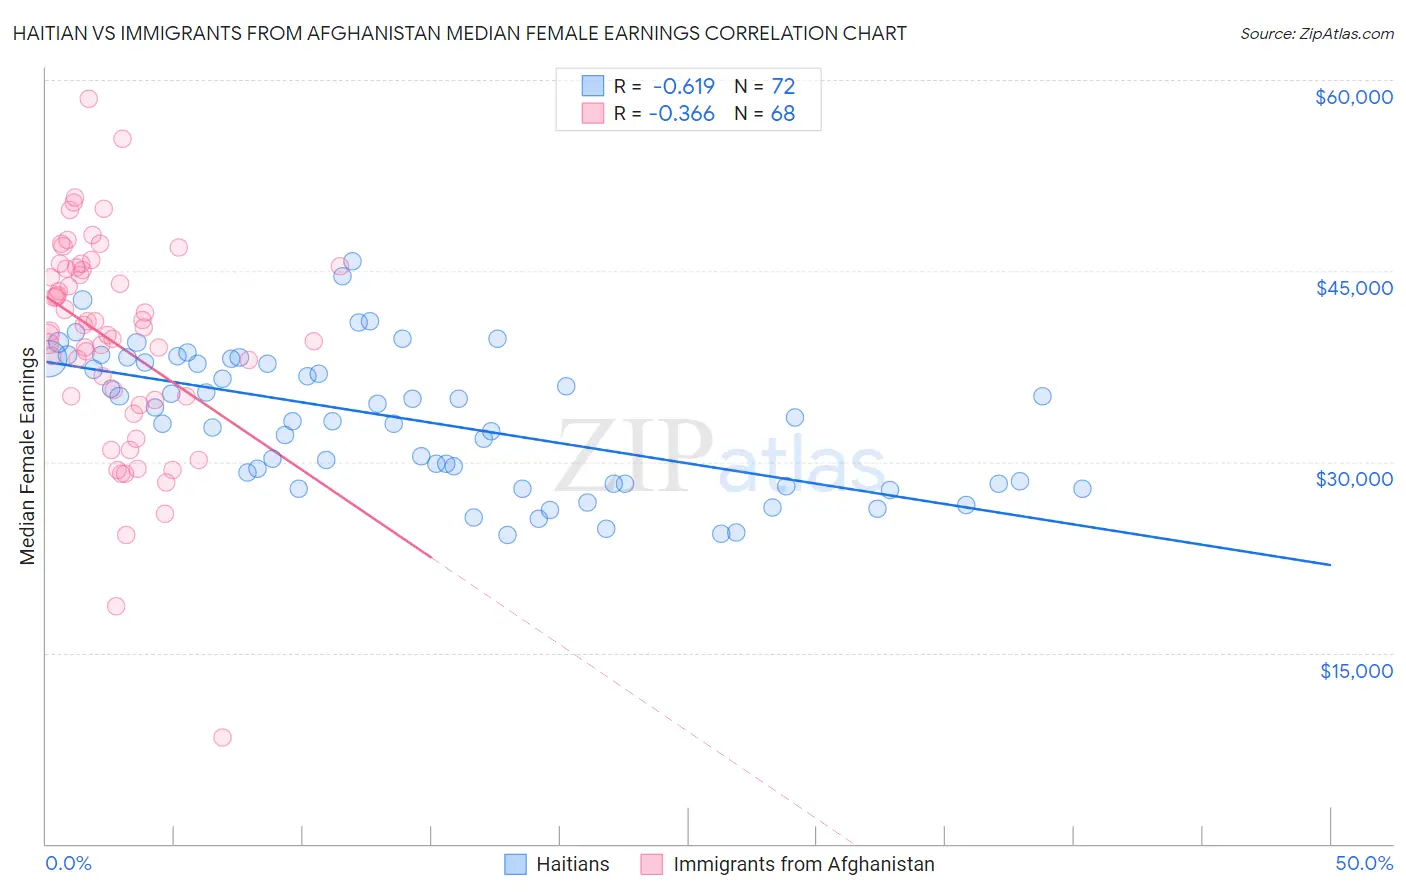
Haitian vs Immigrants from Afghanistan Median Female Earnings Correlation Chart
The statistical analysis conducted on geographies consisting of 287,899,387 people shows a significant negative correlation between the proportion of Haitians and median female earnings in the United States with a correlation coefficient (R) of -0.619 and weighted average of $36,374. Similarly, the statistical analysis conducted on geographies consisting of 147,640,622 people shows a mild negative correlation between the proportion of Immigrants from Afghanistan and median female earnings in the United States with a correlation coefficient (R) of -0.366 and weighted average of $42,055, a difference of 15.6%.
Median Female Earnings Correlation Summary
| Measurement | Haitian | Immigrants from Afghanistan |
| Minimum | $24,245 | $8,380 |
| Maximum | $45,799 | $58,562 |
| Range | $21,554 | $50,182 |
| Mean | $33,333 | $39,466 |
| Median | $33,334 | $40,414 |
| Interquartile 25% (IQ1) | $28,287 | $34,989 |
| Interquartile 75% (IQ3) | $37,934 | $45,239 |
| Interquartile Range (IQR) | $9,647 | $10,250 |
| Standard Deviation (Sample) | $5,376 | $8,425 |
| Standard Deviation (Population) | $5,339 | $8,363 |
Similar Demographics by Median Female Earnings
Demographics Similar to Haitians by Median Female Earnings
In terms of median female earnings, the demographic groups most similar to Haitians are Spanish American ($36,391, a difference of 0.050%), Iroquois ($36,408, a difference of 0.090%), Immigrants from Caribbean ($36,414, a difference of 0.11%), U.S. Virgin Islander ($36,424, a difference of 0.14%), and Marshallese ($36,459, a difference of 0.24%).
| Demographics | Rating | Rank | Median Female Earnings |
| Africans | 0.1 /100 | #275 | Tragic $36,530 |
| Central Americans | 0.1 /100 | #276 | Tragic $36,492 |
| Marshallese | 0.1 /100 | #277 | Tragic $36,459 |
| U.S. Virgin Islanders | 0.1 /100 | #278 | Tragic $36,424 |
| Immigrants | Caribbean | 0.1 /100 | #279 | Tragic $36,414 |
| Iroquois | 0.1 /100 | #280 | Tragic $36,408 |
| Spanish Americans | 0.1 /100 | #281 | Tragic $36,391 |
| Haitians | 0.1 /100 | #282 | Tragic $36,374 |
| Immigrants | Haiti | 0.1 /100 | #283 | Tragic $36,203 |
| Indonesians | 0.1 /100 | #284 | Tragic $36,140 |
| Paiute | 0.1 /100 | #285 | Tragic $36,056 |
| Osage | 0.0 /100 | #286 | Tragic $36,034 |
| Immigrants | Nicaragua | 0.0 /100 | #287 | Tragic $36,023 |
| Immigrants | Zaire | 0.0 /100 | #288 | Tragic $36,017 |
| Bangladeshis | 0.0 /100 | #289 | Tragic $35,960 |
Demographics Similar to Immigrants from Afghanistan by Median Female Earnings
In terms of median female earnings, the demographic groups most similar to Immigrants from Afghanistan are Immigrants from Northern Africa ($42,084, a difference of 0.070%), Ukrainian ($42,015, a difference of 0.10%), Lithuanian ($42,108, a difference of 0.12%), Immigrants from St. Vincent and the Grenadines ($42,108, a difference of 0.13%), and Immigrants from Western Europe ($41,990, a difference of 0.15%).
| Demographics | Rating | Rank | Median Female Earnings |
| Immigrants | Morocco | 99.5 /100 | #82 | Exceptional $42,229 |
| Immigrants | Sierra Leone | 99.5 /100 | #83 | Exceptional $42,214 |
| Armenians | 99.5 /100 | #84 | Exceptional $42,212 |
| Laotians | 99.4 /100 | #85 | Exceptional $42,133 |
| Immigrants | St. Vincent and the Grenadines | 99.3 /100 | #86 | Exceptional $42,108 |
| Lithuanians | 99.3 /100 | #87 | Exceptional $42,108 |
| Immigrants | Northern Africa | 99.3 /100 | #88 | Exceptional $42,084 |
| Immigrants | Afghanistan | 99.3 /100 | #89 | Exceptional $42,055 |
| Ukrainians | 99.2 /100 | #90 | Exceptional $42,015 |
| Immigrants | Western Europe | 99.2 /100 | #91 | Exceptional $41,990 |
| Argentineans | 99.1 /100 | #92 | Exceptional $41,952 |
| Immigrants | Grenada | 99.0 /100 | #93 | Exceptional $41,932 |
| Moroccans | 98.9 /100 | #94 | Exceptional $41,872 |
| Immigrants | Netherlands | 98.9 /100 | #95 | Exceptional $41,870 |
| South Africans | 98.8 /100 | #96 | Exceptional $41,825 |