Guamanian/Chamorro vs Cuban Householder Income Under 25 years
COMPARE
Guamanian/Chamorro
Cuban
Householder Income Under 25 years
Householder Income Under 25 years Comparison
Guamanians/Chamorros
Cubans
$53,423
HOUSEHOLDER INCOME UNDER 25 YEARS
95.3/ 100
METRIC RATING
120th/ 347
METRIC RANK
$50,655
HOUSEHOLDER INCOME UNDER 25 YEARS
2.3/ 100
METRIC RATING
242nd/ 347
METRIC RANK
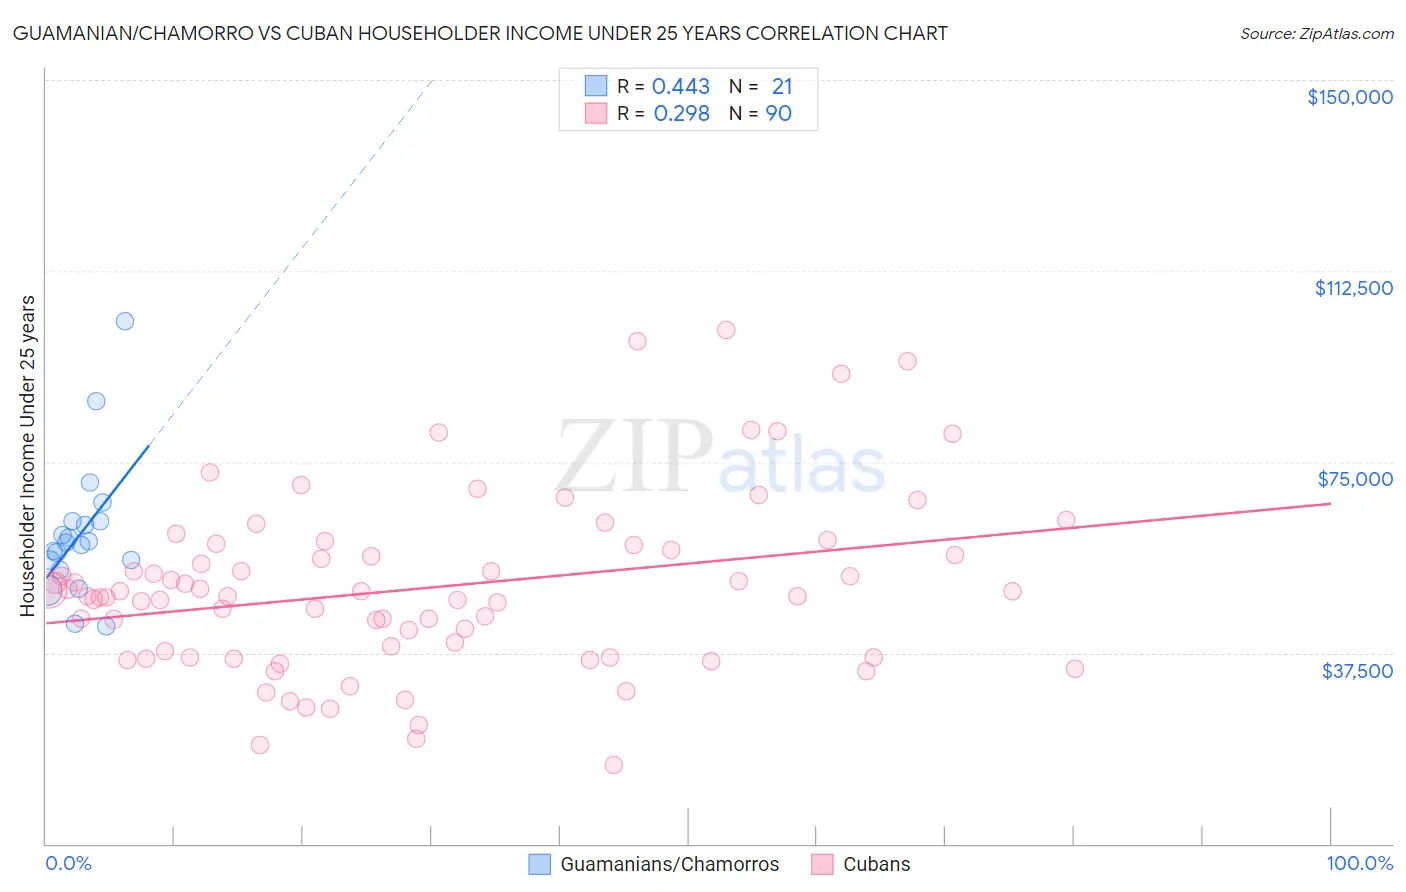
Guamanian/Chamorro vs Cuban Householder Income Under 25 years Correlation Chart
The statistical analysis conducted on geographies consisting of 200,760,858 people shows a moderate positive correlation between the proportion of Guamanians/Chamorros and household income with householder under the age of 25 in the United States with a correlation coefficient (R) of 0.443 and weighted average of $53,423. Similarly, the statistical analysis conducted on geographies consisting of 372,353,328 people shows a weak positive correlation between the proportion of Cubans and household income with householder under the age of 25 in the United States with a correlation coefficient (R) of 0.298 and weighted average of $50,655, a difference of 5.5%.
Householder Income Under 25 years Correlation Summary
| Measurement | Guamanian/Chamorro | Cuban |
| Minimum | $42,829 | $15,559 |
| Maximum | $102,571 | $100,948 |
| Range | $59,742 | $85,389 |
| Mean | $60,959 | $50,192 |
| Median | $59,082 | $48,589 |
| Interquartile 25% (IQ1) | $54,739 | $36,667 |
| Interquartile 75% (IQ3) | $63,324 | $57,791 |
| Interquartile Range (IQR) | $8,585 | $21,124 |
| Standard Deviation (Sample) | $13,387 | $17,185 |
| Standard Deviation (Population) | $13,064 | $17,090 |
Similar Demographics by Householder Income Under 25 years
Demographics Similar to Guamanians/Chamorros by Householder Income Under 25 years
In terms of householder income under 25 years, the demographic groups most similar to Guamanians/Chamorros are Italian ($53,426, a difference of 0.010%), Immigrants from Canada ($53,411, a difference of 0.020%), Immigrants from Ethiopia ($53,408, a difference of 0.030%), Immigrants from Iraq ($53,384, a difference of 0.070%), and Colombian ($53,357, a difference of 0.12%).
| Demographics | Rating | Rank | Householder Income Under 25 years |
| Romanians | 97.2 /100 | #113 | Exceptional $53,632 |
| Immigrants | Sweden | 97.1 /100 | #114 | Exceptional $53,621 |
| Immigrants | Albania | 96.9 /100 | #115 | Exceptional $53,597 |
| Immigrants | Spain | 96.6 /100 | #116 | Exceptional $53,560 |
| Lithuanians | 96.6 /100 | #117 | Exceptional $53,552 |
| Immigrants | Switzerland | 96.3 /100 | #118 | Exceptional $53,528 |
| Italians | 95.4 /100 | #119 | Exceptional $53,426 |
| Guamanians/Chamorros | 95.3 /100 | #120 | Exceptional $53,423 |
| Immigrants | Canada | 95.2 /100 | #121 | Exceptional $53,411 |
| Immigrants | Ethiopia | 95.2 /100 | #122 | Exceptional $53,408 |
| Immigrants | Iraq | 94.9 /100 | #123 | Exceptional $53,384 |
| Colombians | 94.6 /100 | #124 | Exceptional $53,357 |
| Pakistanis | 94.1 /100 | #125 | Exceptional $53,325 |
| Immigrants | Serbia | 94.1 /100 | #126 | Exceptional $53,321 |
| Immigrants | North America | 93.9 /100 | #127 | Exceptional $53,307 |
Demographics Similar to Cubans by Householder Income Under 25 years
In terms of householder income under 25 years, the demographic groups most similar to Cubans are Immigrants from Thailand ($50,645, a difference of 0.020%), Marshallese ($50,627, a difference of 0.060%), Immigrants from Micronesia ($50,691, a difference of 0.070%), Immigrants from Africa ($50,609, a difference of 0.090%), and Welsh ($50,597, a difference of 0.12%).
| Demographics | Rating | Rank | Householder Income Under 25 years |
| Spanish | 3.3 /100 | #235 | Tragic $50,813 |
| English | 3.3 /100 | #236 | Tragic $50,805 |
| Germans | 3.3 /100 | #237 | Tragic $50,804 |
| Iraqis | 3.2 /100 | #238 | Tragic $50,802 |
| Immigrants | Caribbean | 2.9 /100 | #239 | Tragic $50,757 |
| Immigrants | Lebanon | 2.7 /100 | #240 | Tragic $50,729 |
| Immigrants | Micronesia | 2.5 /100 | #241 | Tragic $50,691 |
| Cubans | 2.3 /100 | #242 | Tragic $50,655 |
| Immigrants | Thailand | 2.2 /100 | #243 | Tragic $50,645 |
| Marshallese | 2.1 /100 | #244 | Tragic $50,627 |
| Immigrants | Africa | 2.0 /100 | #245 | Tragic $50,609 |
| Welsh | 2.0 /100 | #246 | Tragic $50,597 |
| Immigrants | Bosnia and Herzegovina | 1.8 /100 | #247 | Tragic $50,565 |
| Slavs | 1.8 /100 | #248 | Tragic $50,563 |
| Scottish | 1.8 /100 | #249 | Tragic $50,554 |