Ghanaian vs Immigrants from Armenia Median Earnings
COMPARE
Ghanaian
Immigrants from Armenia
Median Earnings
Median Earnings Comparison
Ghanaians
Immigrants from Armenia
$46,440
MEDIAN EARNINGS
50.3/ 100
METRIC RATING
173rd/ 347
METRIC RANK
$46,094
MEDIAN EARNINGS
38.3/ 100
METRIC RATING
188th/ 347
METRIC RANK
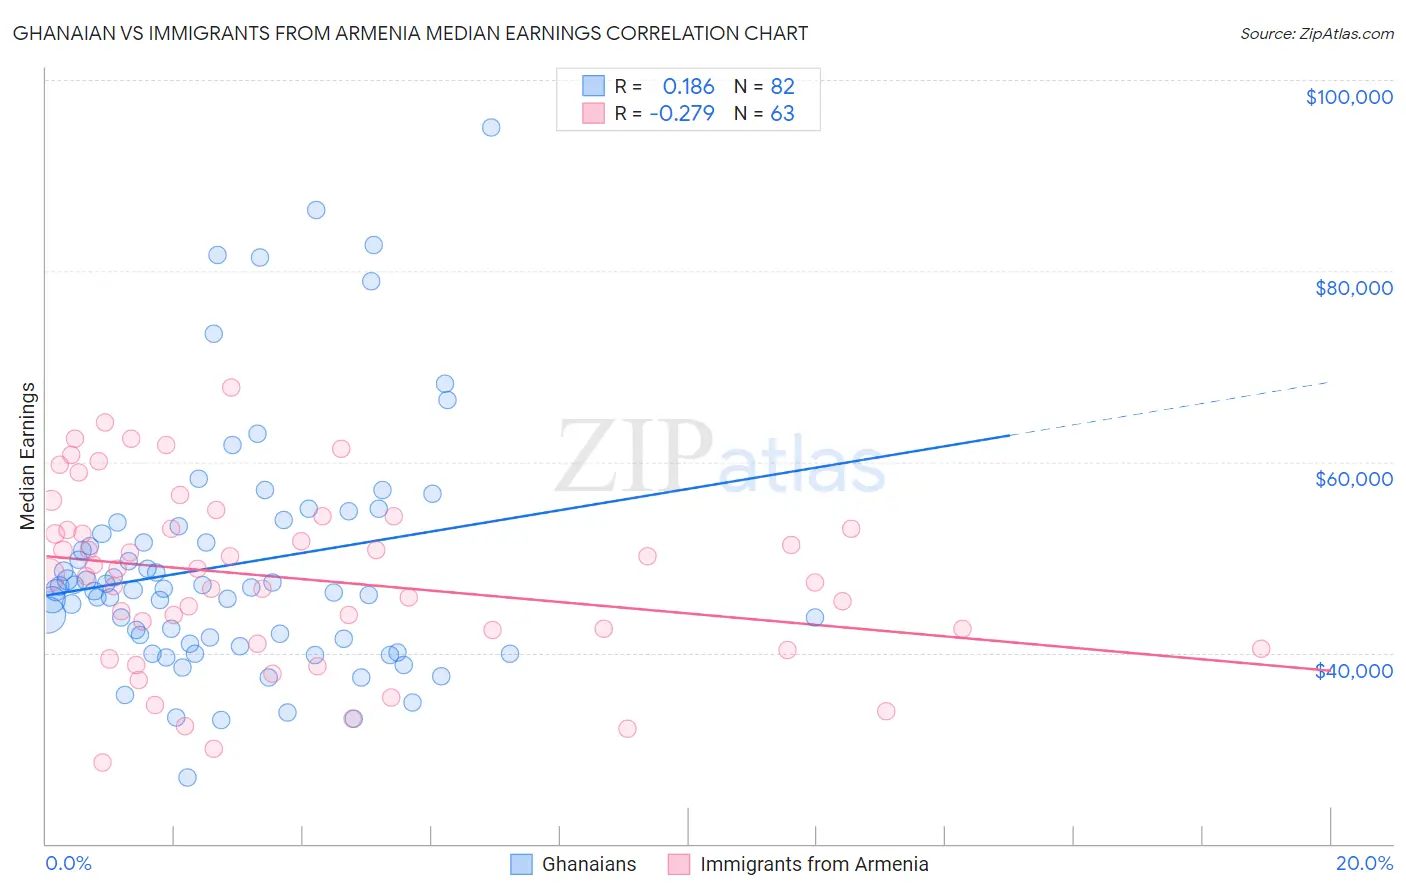
Ghanaian vs Immigrants from Armenia Median Earnings Correlation Chart
The statistical analysis conducted on geographies consisting of 190,721,240 people shows a poor positive correlation between the proportion of Ghanaians and median earnings in the United States with a correlation coefficient (R) of 0.186 and weighted average of $46,440. Similarly, the statistical analysis conducted on geographies consisting of 97,724,966 people shows a weak negative correlation between the proportion of Immigrants from Armenia and median earnings in the United States with a correlation coefficient (R) of -0.279 and weighted average of $46,094, a difference of 0.75%.
Median Earnings Correlation Summary
| Measurement | Ghanaian | Immigrants from Armenia |
| Minimum | $26,919 | $28,479 |
| Maximum | $94,961 | $67,833 |
| Range | $68,042 | $39,354 |
| Mean | $49,239 | $47,758 |
| Median | $46,600 | $48,131 |
| Interquartile 25% (IQ1) | $40,949 | $40,972 |
| Interquartile 75% (IQ3) | $53,241 | $53,018 |
| Interquartile Range (IQR) | $12,292 | $12,046 |
| Standard Deviation (Sample) | $12,902 | $9,191 |
| Standard Deviation (Population) | $12,823 | $9,118 |
Demographics Similar to Ghanaians and Immigrants from Armenia by Median Earnings
In terms of median earnings, the demographic groups most similar to Ghanaians are Scandinavian ($46,433, a difference of 0.020%), Scottish ($46,463, a difference of 0.050%), Kenyan ($46,462, a difference of 0.050%), Immigrants ($46,478, a difference of 0.080%), and Basque ($46,399, a difference of 0.090%). Similarly, the demographic groups most similar to Immigrants from Armenia are Spaniard ($46,059, a difference of 0.080%), Iraqi ($46,140, a difference of 0.10%), French Canadian ($46,026, a difference of 0.15%), Vietnamese ($46,172, a difference of 0.17%), and Uruguayan ($46,190, a difference of 0.21%).
| Demographics | Rating | Rank | Median Earnings |
| Immigrants | Immigrants | 51.6 /100 | #170 | Average $46,478 |
| Scottish | 51.1 /100 | #171 | Average $46,463 |
| Kenyans | 51.0 /100 | #172 | Average $46,462 |
| Ghanaians | 50.3 /100 | #173 | Average $46,440 |
| Scandinavians | 50.0 /100 | #174 | Average $46,433 |
| Basques | 48.8 /100 | #175 | Average $46,399 |
| Danes | 48.6 /100 | #176 | Average $46,392 |
| Belgians | 48.0 /100 | #177 | Average $46,375 |
| Colombians | 47.1 /100 | #178 | Average $46,349 |
| English | 46.5 /100 | #179 | Average $46,334 |
| Puget Sound Salish | 46.5 /100 | #180 | Average $46,333 |
| Immigrants | Cameroon | 46.4 /100 | #181 | Average $46,329 |
| Swiss | 45.9 /100 | #182 | Average $46,315 |
| French | 45.2 /100 | #183 | Average $46,296 |
| Immigrants | Kenya | 42.4 /100 | #184 | Average $46,214 |
| Uruguayans | 41.6 /100 | #185 | Average $46,190 |
| Vietnamese | 40.9 /100 | #186 | Average $46,172 |
| Iraqis | 39.9 /100 | #187 | Fair $46,140 |
| Immigrants | Armenia | 38.3 /100 | #188 | Fair $46,094 |
| Spaniards | 37.2 /100 | #189 | Fair $46,059 |
| French Canadians | 36.1 /100 | #190 | Fair $46,026 |