French vs Spanish American Householder Income Ages 25 - 44 years
COMPARE
French
Spanish American
Householder Income Ages 25 - 44 years
Householder Income Ages 25 - 44 years Comparison
French
Spanish Americans
$93,665
HOUSEHOLDER INCOME AGES 25 - 44 YEARS
37.8/ 100
METRIC RATING
180th/ 347
METRIC RANK
$83,722
HOUSEHOLDER INCOME AGES 25 - 44 YEARS
0.2/ 100
METRIC RATING
272nd/ 347
METRIC RANK
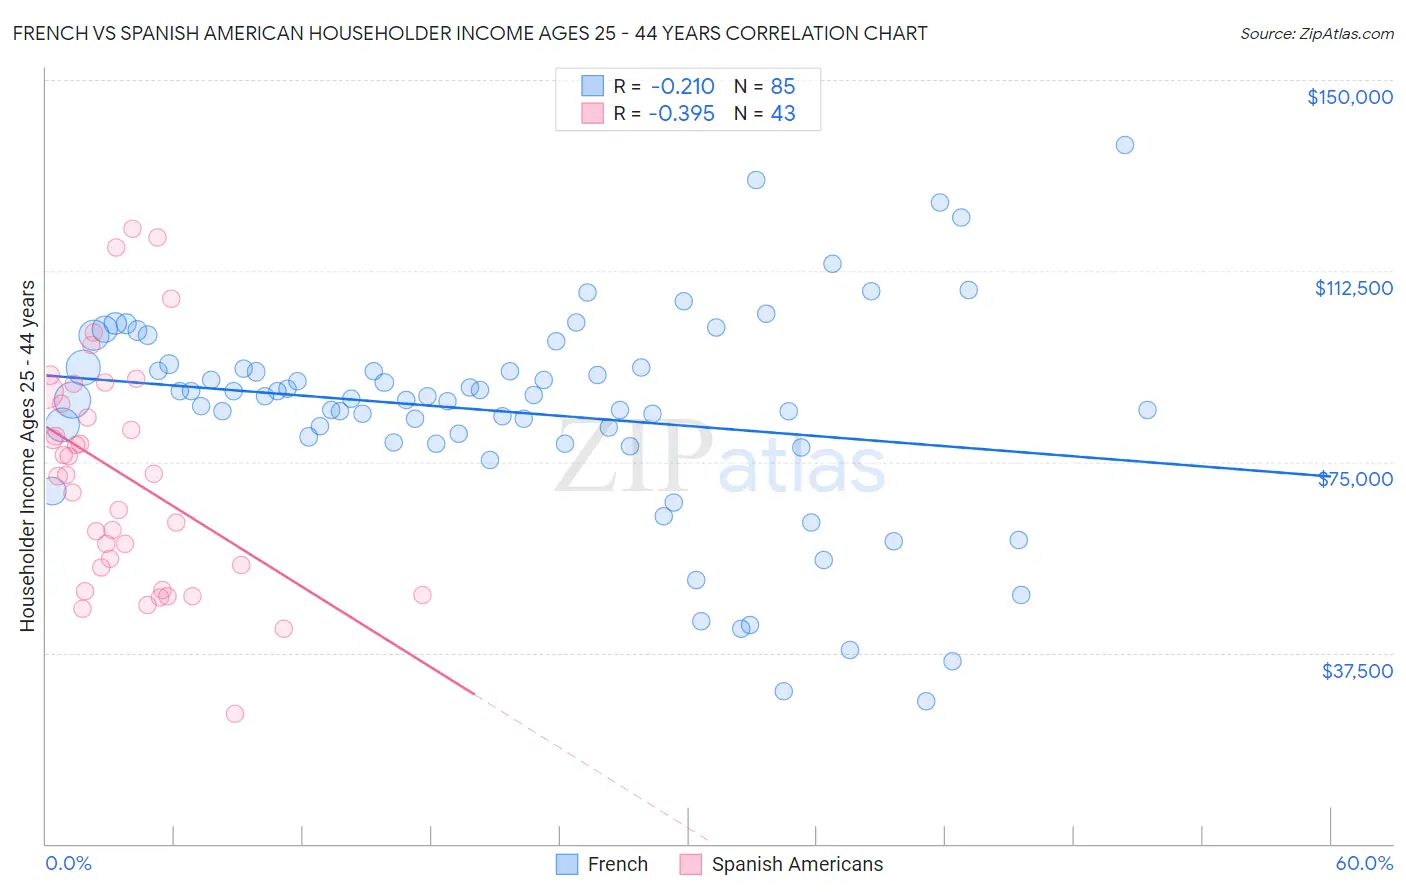
French vs Spanish American Householder Income Ages 25 - 44 years Correlation Chart
The statistical analysis conducted on geographies consisting of 566,574,602 people shows a weak negative correlation between the proportion of French and household income with householder between the ages 25 and 44 in the United States with a correlation coefficient (R) of -0.210 and weighted average of $93,665. Similarly, the statistical analysis conducted on geographies consisting of 103,075,966 people shows a mild negative correlation between the proportion of Spanish Americans and household income with householder between the ages 25 and 44 in the United States with a correlation coefficient (R) of -0.395 and weighted average of $83,722, a difference of 11.9%.
Householder Income Ages 25 - 44 years Correlation Summary
| Measurement | French | Spanish American |
| Minimum | $28,047 | $25,625 |
| Maximum | $137,237 | $120,725 |
| Range | $109,190 | $95,100 |
| Mean | $84,736 | $72,343 |
| Median | $87,325 | $72,340 |
| Interquartile 25% (IQ1) | $78,650 | $54,252 |
| Interquartile 75% (IQ3) | $93,493 | $88,756 |
| Interquartile Range (IQR) | $14,843 | $34,503 |
| Standard Deviation (Sample) | $21,004 | $22,283 |
| Standard Deviation (Population) | $20,880 | $22,022 |
Similar Demographics by Householder Income Ages 25 - 44 years
Demographics Similar to French by Householder Income Ages 25 - 44 years
In terms of householder income ages 25 - 44 years, the demographic groups most similar to French are Puget Sound Salish ($93,661, a difference of 0.0%), French Canadian ($93,694, a difference of 0.030%), Uruguayan ($93,631, a difference of 0.040%), Guamanian/Chamorro ($93,569, a difference of 0.10%), and German ($93,531, a difference of 0.14%).
| Demographics | Rating | Rank | Householder Income Ages 25 - 44 years |
| Finns | 50.6 /100 | #173 | Average $94,610 |
| Colombians | 50.0 /100 | #174 | Average $94,565 |
| English | 48.1 /100 | #175 | Average $94,429 |
| Immigrants | Immigrants | 48.0 /100 | #176 | Average $94,423 |
| Belgians | 45.8 /100 | #177 | Average $94,262 |
| Immigrants | South America | 42.8 /100 | #178 | Average $94,042 |
| French Canadians | 38.2 /100 | #179 | Fair $93,694 |
| French | 37.8 /100 | #180 | Fair $93,665 |
| Puget Sound Salish | 37.7 /100 | #181 | Fair $93,661 |
| Uruguayans | 37.3 /100 | #182 | Fair $93,631 |
| Guamanians/Chamorros | 36.5 /100 | #183 | Fair $93,569 |
| Germans | 36.0 /100 | #184 | Fair $93,531 |
| Immigrants | Eritrea | 35.2 /100 | #185 | Fair $93,466 |
| Sierra Leoneans | 34.8 /100 | #186 | Fair $93,435 |
| Spaniards | 34.0 /100 | #187 | Fair $93,366 |
Demographics Similar to Spanish Americans by Householder Income Ages 25 - 44 years
In terms of householder income ages 25 - 44 years, the demographic groups most similar to Spanish Americans are Somali ($83,752, a difference of 0.040%), Iroquois ($83,682, a difference of 0.050%), Marshallese ($83,575, a difference of 0.18%), Jamaican ($83,933, a difference of 0.25%), and Spanish American Indian ($84,085, a difference of 0.43%).
| Demographics | Rating | Rank | Householder Income Ages 25 - 44 years |
| Sudanese | 0.4 /100 | #265 | Tragic $84,401 |
| Immigrants | Cabo Verde | 0.3 /100 | #266 | Tragic $84,304 |
| Hmong | 0.3 /100 | #267 | Tragic $84,258 |
| Sub-Saharan Africans | 0.3 /100 | #268 | Tragic $84,235 |
| Spanish American Indians | 0.3 /100 | #269 | Tragic $84,085 |
| Jamaicans | 0.3 /100 | #270 | Tragic $83,933 |
| Somalis | 0.2 /100 | #271 | Tragic $83,752 |
| Spanish Americans | 0.2 /100 | #272 | Tragic $83,722 |
| Iroquois | 0.2 /100 | #273 | Tragic $83,682 |
| Marshallese | 0.2 /100 | #274 | Tragic $83,575 |
| Immigrants | Jamaica | 0.2 /100 | #275 | Tragic $83,298 |
| Immigrants | Belize | 0.2 /100 | #276 | Tragic $83,141 |
| Paiute | 0.2 /100 | #277 | Tragic $82,984 |
| Senegalese | 0.2 /100 | #278 | Tragic $82,852 |
| Pima | 0.1 /100 | #279 | Tragic $82,821 |