French vs Spanish American Indian Householder Income Under 25 years

COMPARE

French
Race
Ancestry
AfghanAfricanAlaska NativeAlaskan AthabascanAlbanianAleutAlsatianAmericanApacheArabArapahoArgentineanArmenianAssyrian/Chaldean/SyriacAustralianAustrianBahamianBangladeshiBarbadianBasqueBelgianBelizeanBermudanBhutaneseBlackfeetBolivianBrazilianBritishBritish West IndianBulgarianBurmeseCajunCambodianCanadianCape VerdeanCarpatho RusynCelticCentral AmericanCentral American IndianCherokeeCheyenneChickasawChileanChineseChippewaChoctawColombianColvilleComancheCosta RicanCreeCreekCroatianCrowCubanCypriotCzechCzechoslovakianDanishDelawareDominicanDutchDutch West IndianEastern EuropeanEcuadorianEgyptianEnglishEstonianEthiopianEuropeanFijianFilipinoFinnishFrenchFrench American IndianFrench CanadianGermanGerman RussianGhanaianGreekGuamanian/ChamorroGuatemalanGuyaneseHaitianHmongHonduranHopiHoumaHungarianIcelanderIndian (Asian)IndonesianInupiatIranianIraqiIrishIroquoisIsraeliItalianJamaicanJapaneseJordanianKenyanKiowaKoreanLaotianLatvianLebaneseLiberianLithuanianLumbeeLuxembourgerMacedonianMalaysianMalteseMarshalleseMenomineeMexicanMexican American IndianMongolianMoroccanNative HawaiianNavajoNepaleseNew ZealanderNicaraguanNigerianNorthern EuropeanNorwegianOkinawanOsageOttawaPaiutePakistaniPalestinianPanamanianParaguayanPennsylvania GermanPeruvianPimaPolishPortuguesePotawatomiPuebloPuerto RicanPuget Sound SalishRomanianRussianSalvadoranSamoanScandinavianScotch-IrishScottishSeminoleSenegaleseSerbianShoshoneSierra LeoneanSiouxSlavicSlovakSloveneSomaliSouth AfricanSouth AmericanSouth American IndianSoviet UnionSpaniardSpanishSpanish AmericanSri LankanSubsaharan AfricanSudaneseSwedishSwissSyrianTaiwaneseThaiTlingit-HaidaTohono O'OdhamTonganTrinidadian and TobagonianTsimshianTurkishU.S. Virgin IslanderUgandanUkrainianUruguayanUteVenezuelanVietnameseWelshWest IndianYakamaYaquiYugoslavianYumanYup'ikZimbabwean
Immigration
NonimmigrantsImmigrantsAfghanistanAfricaAlbaniaArgentinaArmeniaAsiaAustraliaAustriaBahamasBangladeshBarbadosBelarusBelgiumBelizeBoliviaBosnia and HerzegovinaBrazilBulgariaBurma/MyanmarCabo VerdeCambodiaCameroonCanadaCaribbeanCentral AmericaChileChinaColombiaCongoCosta RicaCroatiaCubaCzechoslovakiaDenmarkDominicaDominican RepublicEastern AfricaEastern AsiaEastern EuropeEcuadorEgyptEl SalvadorEnglandEritreaEthiopiaEuropeFijiFranceGermanyGhanaGreeceGrenadaGuatemalaGuyanaHaitiHondurasHong KongHungaryIndiaIndonesiaIranIraqIrelandIsraelItalyJamaicaJapanJordanKazakhstanKenyaKoreaKuwaitLaosLatin AmericaLatviaLebanonLiberiaLithuaniaMalaysiaMexicoMicronesiaMiddle AfricaMoldovaMoroccoNepalNetherlandsNicaraguaNigeriaNorth AmericaNorth MacedoniaNorthern AfricaNorthern EuropeNorwayOceaniaPakistanPanamaPeruPhilippinesPolandPortugalRomaniaRussiaSaudi ArabiaScotlandSenegalSerbiaSierra LeoneSingaporeSomaliaSouth AfricaSouth AmericaSouth Central AsiaSouth Eastern AsiaSouthern EuropeSpainSri LankaSt. Vincent and the GrenadinesSudanSwedenSwitzerlandSyriaTaiwanThailandTrinidad and TobagoTurkeyUgandaUkraineUruguayUzbekistanVenezuelaVietnamWest IndiesWestern AfricaWestern AsiaWestern EuropeYemenZaireZimbabweAzores
Spanish American Indian
Race
Ancestry
AfghanAfricanAlaska NativeAlaskan AthabascanAlbanianAleutAlsatianAmericanApacheArabArapahoArgentineanArmenianAssyrian/Chaldean/SyriacAustralianAustrianBahamianBangladeshiBarbadianBasqueBelgianBelizeanBermudanBhutaneseBlackfeetBolivianBrazilianBritishBritish West IndianBulgarianBurmeseCajunCambodianCanadianCape VerdeanCarpatho RusynCelticCentral AmericanCentral American IndianCherokeeCheyenneChickasawChileanChineseChippewaChoctawColombianColvilleComancheCosta RicanCreeCreekCroatianCrowCubanCypriotCzechCzechoslovakianDanishDelawareDominicanDutchDutch West IndianEastern EuropeanEcuadorianEgyptianEnglishEstonianEthiopianEuropeanFijianFilipinoFinnishFrench American IndianFrench CanadianGermanGerman RussianGhanaianGreekGuamanian/ChamorroGuatemalanGuyaneseHaitianHmongHonduranHopiHoumaHungarianIcelanderIndian (Asian)IndonesianInupiatIranianIraqiIrishIroquoisIsraeliItalianJamaicanJapaneseJordanianKenyanKiowaKoreanLaotianLatvianLebaneseLiberianLithuanianLumbeeLuxembourgerMacedonianMalaysianMalteseMarshalleseMenomineeMexicanMexican American IndianMongolianMoroccanNative HawaiianNavajoNepaleseNew ZealanderNicaraguanNigerianNorthern EuropeanNorwegianOkinawanOsageOttawaPaiutePakistaniPalestinianPanamanianParaguayanPennsylvania GermanPeruvianPimaPolishPortuguesePotawatomiPuebloPuerto RicanPuget Sound SalishRomanianRussianSalvadoranSamoanScandinavianScotch-IrishScottishSeminoleSenegaleseSerbianShoshoneSierra LeoneanSiouxSlavicSlovakSloveneSomaliSouth AfricanSouth AmericanSouth American IndianSoviet UnionSpaniardSpanishSpanish AmericanSpanish American IndianSri LankanSubsaharan AfricanSudaneseSwedishSwissSyrianTaiwaneseThaiTlingit-HaidaTohono O'OdhamTonganTrinidadian and TobagonianTsimshianTurkishU.S. Virgin IslanderUgandanUkrainianUruguayanUteVenezuelanVietnameseWelshWest IndianYakamaYaquiYugoslavianYumanYup'ikZimbabwean
Immigration
NonimmigrantsImmigrantsAfghanistanAfricaAlbaniaArgentinaArmeniaAsiaAustraliaAustriaBahamasBangladeshBarbadosBelarusBelgiumBelizeBoliviaBosnia and HerzegovinaBrazilBulgariaBurma/MyanmarCabo VerdeCambodiaCameroonCanadaCaribbeanCentral AmericaChileChinaColombiaCongoCosta RicaCroatiaCubaCzechoslovakiaDenmarkDominicaDominican RepublicEastern AfricaEastern AsiaEastern EuropeEcuadorEgyptEl SalvadorEnglandEritreaEthiopiaEuropeFijiFranceGermanyGhanaGreeceGrenadaGuatemalaGuyanaHaitiHondurasHong KongHungaryIndiaIndonesiaIranIraqIrelandIsraelItalyJamaicaJapanJordanKazakhstanKenyaKoreaKuwaitLaosLatin AmericaLatviaLebanonLiberiaLithuaniaMalaysiaMexicoMicronesiaMiddle AfricaMoldovaMoroccoNepalNetherlandsNicaraguaNigeriaNorth AmericaNorth MacedoniaNorthern AfricaNorthern EuropeNorwayOceaniaPakistanPanamaPeruPhilippinesPolandPortugalRomaniaRussiaSaudi ArabiaScotlandSenegalSerbiaSierra LeoneSingaporeSomaliaSouth AfricaSouth AmericaSouth Central AsiaSouth Eastern AsiaSouthern EuropeSpainSri LankaSt. Vincent and the GrenadinesSudanSwedenSwitzerlandSyriaTaiwanThailandTrinidad and TobagoTurkeyUgandaUkraineUruguayUzbekistanVenezuelaVietnamWest IndiesWestern AfricaWestern AsiaWestern EuropeYemenZaireZimbabweAzores
Householder Income Under 25 years
Income
Poverty
Unemployment
Labor Participation
Family Structure
Vehicle Availability
Education Level
Disability

Householder Income Under 25 years Comparison

French

Spanish American Indians

Tragic
Exceptional
$51,230
HOUSEHOLDER INCOME UNDER 25 YEARS
8.7/ 100
METRIC RATING
216th/ 347
METRIC RANK
$55,573
HOUSEHOLDER INCOME UNDER 25 YEARS
100.0/ 100
METRIC RATING
45th/ 347
METRIC RANK

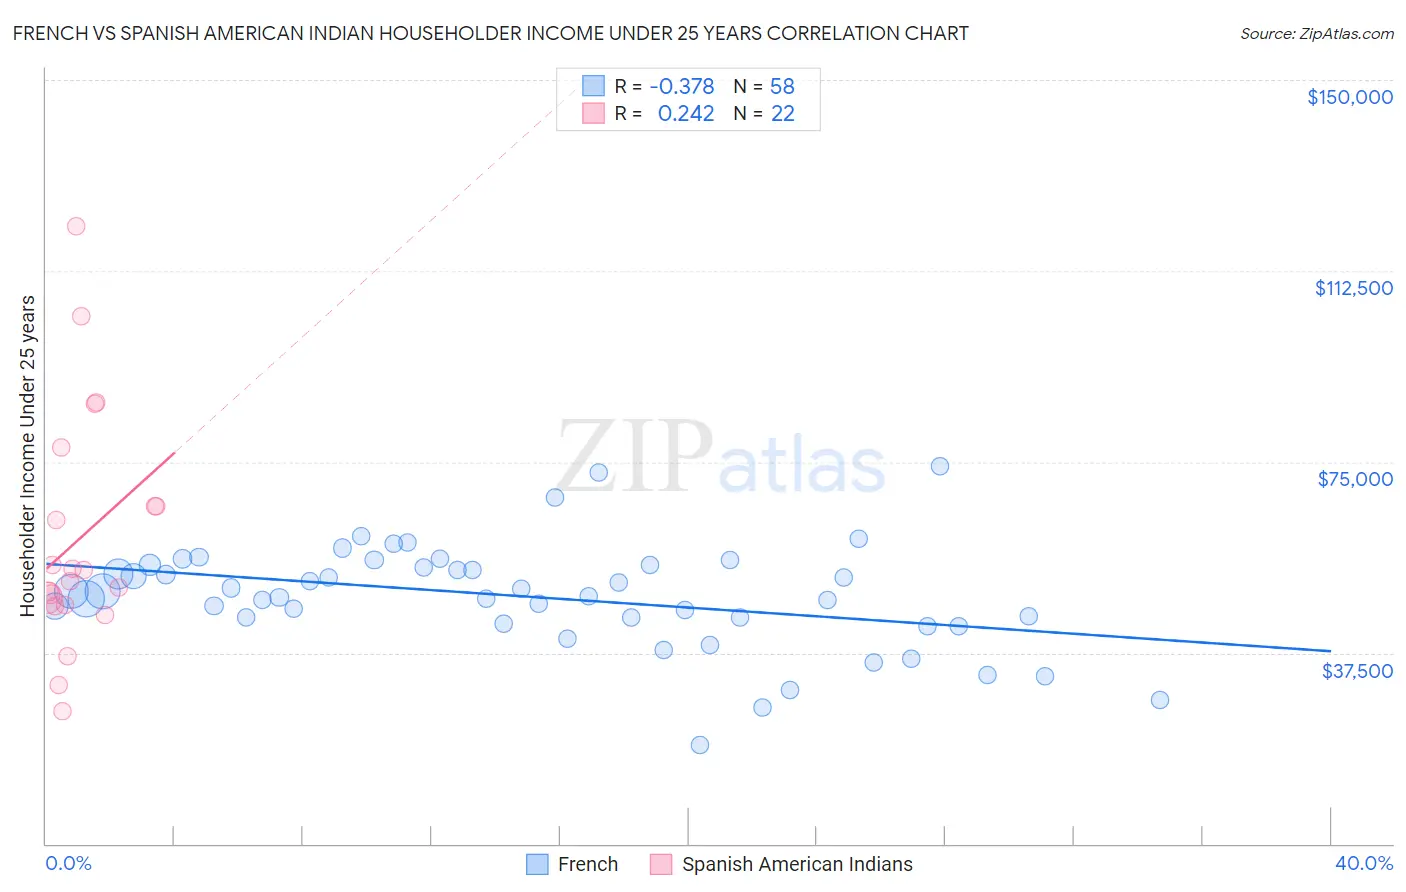
French vs Spanish American Indian Householder Income Under 25 years Correlation Chart

The statistical analysis conducted on geographies consisting of 439,498,922 people shows a mild negative correlation between the proportion of French and household income with householder under the age of 25 in the United States with a correlation coefficient (R) of -0.378 and weighted average of $51,230. Similarly, the statistical analysis conducted on geographies consisting of 69,838,051 people shows a weak positive correlation between the proportion of Spanish American Indians and household income with householder under the age of 25 in the United States with a correlation coefficient (R) of 0.242 and weighted average of $55,573, a difference of 8.5%.
French vs Spanish American Indian Householder Income Under 25 years

Householder Income Under 25 years Correlation Summary

MeasurementFrenchSpanish American Indian
Minimum$19,435$26,095
Maximum$74,028$121,305
Range$54,593$95,210
Mean$48,553$59,799
Median$49,097$52,673
Interquartile 25% (IQ1)$44,353$46,974
Interquartile 75% (IQ3)$54,784$66,250
Interquartile Range (IQR)$10,431$19,276
Standard Deviation (Sample)$10,339$23,098
Standard Deviation (Population)$10,250$22,567

Similar Demographics by Householder Income Under 25 years

Demographics Similar to French by Householder Income Under 25 years

In terms of householder income under 25 years, the demographic groups most similar to French are Czechoslovakian ($51,224, a difference of 0.010%), Immigrants from Belize ($51,223, a difference of 0.010%), Arab ($51,219, a difference of 0.020%), Icelander ($51,247, a difference of 0.030%), and Zimbabwean ($51,259, a difference of 0.060%).
DemographicsRating | RankHouseholder Income Under 25 years
Syrians
11.4
/100
|
#209
Poor
$51,353
Immigrants | Ghana
10.9
/100
|
#210
Poor
$51,333
Irish
10.6
/100
|
#211
Poor
$51,317
Immigrants | Panama
9.7
/100
|
#212
Tragic
$51,278
Dutch
9.4
/100
|
#213
Tragic
$51,265
Zimbabweans
9.3
/100
|
#214
Tragic
$51,259
Icelanders
9.1
/100
|
#215
Tragic
$51,247
French
8.7
/100
|
#216
Tragic
$51,230
Czechoslovakians
8.6
/100
|
#217
Tragic
$51,224
Immigrants | Belize
8.6
/100
|
#218
Tragic
$51,223
Arabs
8.5
/100
|
#219
Tragic
$51,219
Immigrants | Germany
8.0
/100
|
#220
Tragic
$51,190
Immigrants | Eastern Africa
7.4
/100
|
#221
Tragic
$51,158
Spaniards
6.8
/100
|
#222
Tragic
$51,117
Serbians
6.6
/100
|
#223
Tragic
$51,106

Demographics Similar to Spanish American Indians by Householder Income Under 25 years

In terms of householder income under 25 years, the demographic groups most similar to Spanish American Indians are Immigrants from Eastern Europe ($55,572, a difference of 0.0%), Cambodian ($55,571, a difference of 0.0%), Immigrants from Vietnam ($55,562, a difference of 0.020%), Iranian ($55,548, a difference of 0.040%), and Puget Sound Salish ($55,543, a difference of 0.050%).
DemographicsRating | RankHouseholder Income Under 25 years
Immigrants | Iran
100.0
/100
|
#38
Exceptional
$55,880
Immigrants | Belarus
100.0
/100
|
#39
Exceptional
$55,743
Immigrants | Greece
100.0
/100
|
#40
Exceptional
$55,727
Immigrants | Guyana
100.0
/100
|
#41
Exceptional
$55,726
Immigrants | Korea
100.0
/100
|
#42
Exceptional
$55,716
Immigrants | South Eastern Asia
100.0
/100
|
#43
Exceptional
$55,714
Paraguayans
100.0
/100
|
#44
Exceptional
$55,614
Spanish American Indians
100.0
/100
|
#45
Exceptional
$55,573
Immigrants | Eastern Europe
100.0
/100
|
#46
Exceptional
$55,572
Cambodians
100.0
/100
|
#47
Exceptional
$55,571
Immigrants | Vietnam
100.0
/100
|
#48
Exceptional
$55,562
Iranians
100.0
/100
|
#49
Exceptional
$55,548
Puget Sound Salish
100.0
/100
|
#50
Exceptional
$55,543
Immigrants | Romania
100.0
/100
|
#51
Exceptional
$55,522
Immigrants | Indonesia
100.0
/100
|
#52
Exceptional
$55,521