French vs Immigrants from Spain Median Female Earnings
COMPARE
French
Immigrants from Spain
Median Female Earnings
Median Female Earnings Comparison
French
Immigrants from Spain
$38,457
MEDIAN FEMALE EARNINGS
7.0/ 100
METRIC RATING
225th/ 347
METRIC RANK
$42,815
MEDIAN FEMALE EARNINGS
99.8/ 100
METRIC RATING
69th/ 347
METRIC RANK
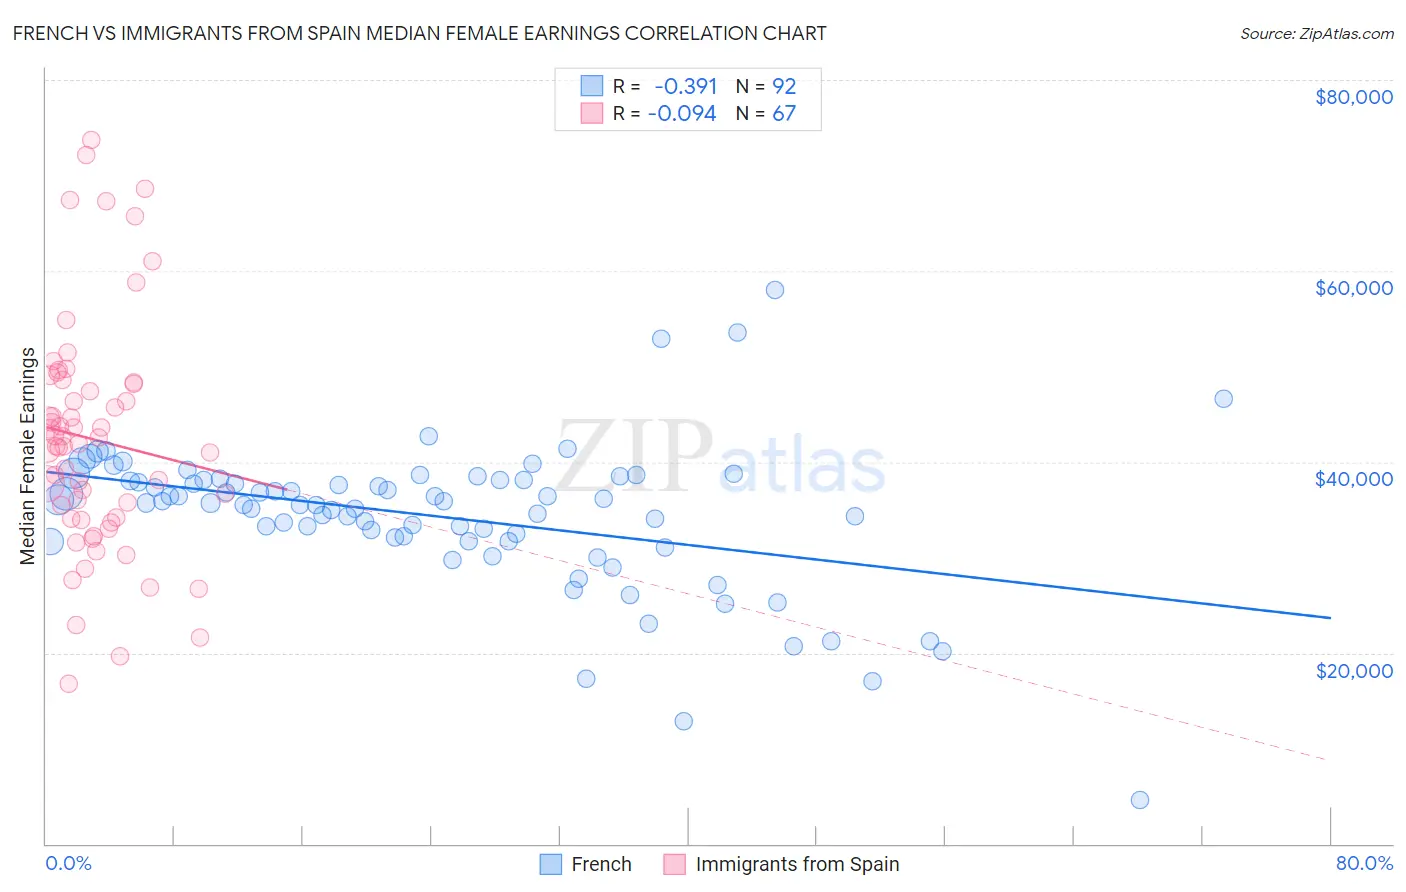
French vs Immigrants from Spain Median Female Earnings Correlation Chart
The statistical analysis conducted on geographies consisting of 570,640,239 people shows a mild negative correlation between the proportion of French and median female earnings in the United States with a correlation coefficient (R) of -0.391 and weighted average of $38,457. Similarly, the statistical analysis conducted on geographies consisting of 239,646,958 people shows a slight negative correlation between the proportion of Immigrants from Spain and median female earnings in the United States with a correlation coefficient (R) of -0.094 and weighted average of $42,815, a difference of 11.3%.
Median Female Earnings Correlation Summary
| Measurement | French | Immigrants from Spain |
| Minimum | $4,625 | $16,765 |
| Maximum | $58,008 | $73,707 |
| Range | $53,383 | $56,942 |
| Mean | $34,289 | $42,367 |
| Median | $35,683 | $41,842 |
| Interquartile 25% (IQ1) | $31,891 | $34,065 |
| Interquartile 75% (IQ3) | $38,063 | $48,345 |
| Interquartile Range (IQR) | $6,171 | $14,280 |
| Standard Deviation (Sample) | $7,750 | $12,186 |
| Standard Deviation (Population) | $7,708 | $12,095 |
Similar Demographics by Median Female Earnings
Demographics Similar to French by Median Female Earnings
In terms of median female earnings, the demographic groups most similar to French are Native Hawaiian ($38,461, a difference of 0.010%), French Canadian ($38,436, a difference of 0.050%), Immigrants from Sudan ($38,511, a difference of 0.14%), Scottish ($38,397, a difference of 0.15%), and Subsaharan African ($38,391, a difference of 0.17%).
| Demographics | Rating | Rank | Median Female Earnings |
| Cape Verdeans | 9.5 /100 | #218 | Tragic $38,614 |
| Nepalese | 9.3 /100 | #219 | Tragic $38,603 |
| Yugoslavians | 8.8 /100 | #220 | Tragic $38,573 |
| Immigrants | Azores | 8.8 /100 | #221 | Tragic $38,573 |
| Japanese | 8.1 /100 | #222 | Tragic $38,528 |
| Immigrants | Sudan | 7.8 /100 | #223 | Tragic $38,511 |
| Native Hawaiians | 7.1 /100 | #224 | Tragic $38,461 |
| French | 7.0 /100 | #225 | Tragic $38,457 |
| French Canadians | 6.8 /100 | #226 | Tragic $38,436 |
| Scottish | 6.3 /100 | #227 | Tragic $38,397 |
| Sub-Saharan Africans | 6.2 /100 | #228 | Tragic $38,391 |
| Belgians | 6.1 /100 | #229 | Tragic $38,382 |
| Basques | 5.7 /100 | #230 | Tragic $38,352 |
| Somalis | 5.5 /100 | #231 | Tragic $38,333 |
| Scandinavians | 5.2 /100 | #232 | Tragic $38,306 |
Demographics Similar to Immigrants from Spain by Median Female Earnings
In terms of median female earnings, the demographic groups most similar to Immigrants from Spain are Immigrants from Austria ($42,824, a difference of 0.020%), Immigrants from Norway ($42,837, a difference of 0.050%), Immigrants from Egypt ($42,837, a difference of 0.050%), Sierra Leonean ($42,868, a difference of 0.12%), and Immigrants from Ethiopia ($42,744, a difference of 0.17%).
| Demographics | Rating | Rank | Median Female Earnings |
| Afghans | 99.9 /100 | #62 | Exceptional $43,077 |
| Immigrants | Ukraine | 99.9 /100 | #63 | Exceptional $43,069 |
| Immigrants | Pakistan | 99.9 /100 | #64 | Exceptional $43,052 |
| Sierra Leoneans | 99.9 /100 | #65 | Exceptional $42,868 |
| Immigrants | Norway | 99.9 /100 | #66 | Exceptional $42,837 |
| Immigrants | Egypt | 99.9 /100 | #67 | Exceptional $42,837 |
| Immigrants | Austria | 99.8 /100 | #68 | Exceptional $42,824 |
| Immigrants | Spain | 99.8 /100 | #69 | Exceptional $42,815 |
| Immigrants | Ethiopia | 99.8 /100 | #70 | Exceptional $42,744 |
| Immigrants | Romania | 99.8 /100 | #71 | Exceptional $42,718 |
| Albanians | 99.8 /100 | #72 | Exceptional $42,584 |
| Mongolians | 99.7 /100 | #73 | Exceptional $42,542 |
| Immigrants | South Africa | 99.7 /100 | #74 | Exceptional $42,508 |
| New Zealanders | 99.7 /100 | #75 | Exceptional $42,446 |
| Immigrants | Italy | 99.7 /100 | #76 | Exceptional $42,446 |