French vs Immigrants from Chile Median Household Income
COMPARE
French
Immigrants from Chile
Median Household Income
Median Household Income Comparison
French
Immigrants from Chile
$83,468
MEDIAN HOUSEHOLD INCOME
26.0/ 100
METRIC RATING
196th/ 347
METRIC RANK
$88,388
MEDIAN HOUSEHOLD INCOME
89.2/ 100
METRIC RATING
139th/ 347
METRIC RANK
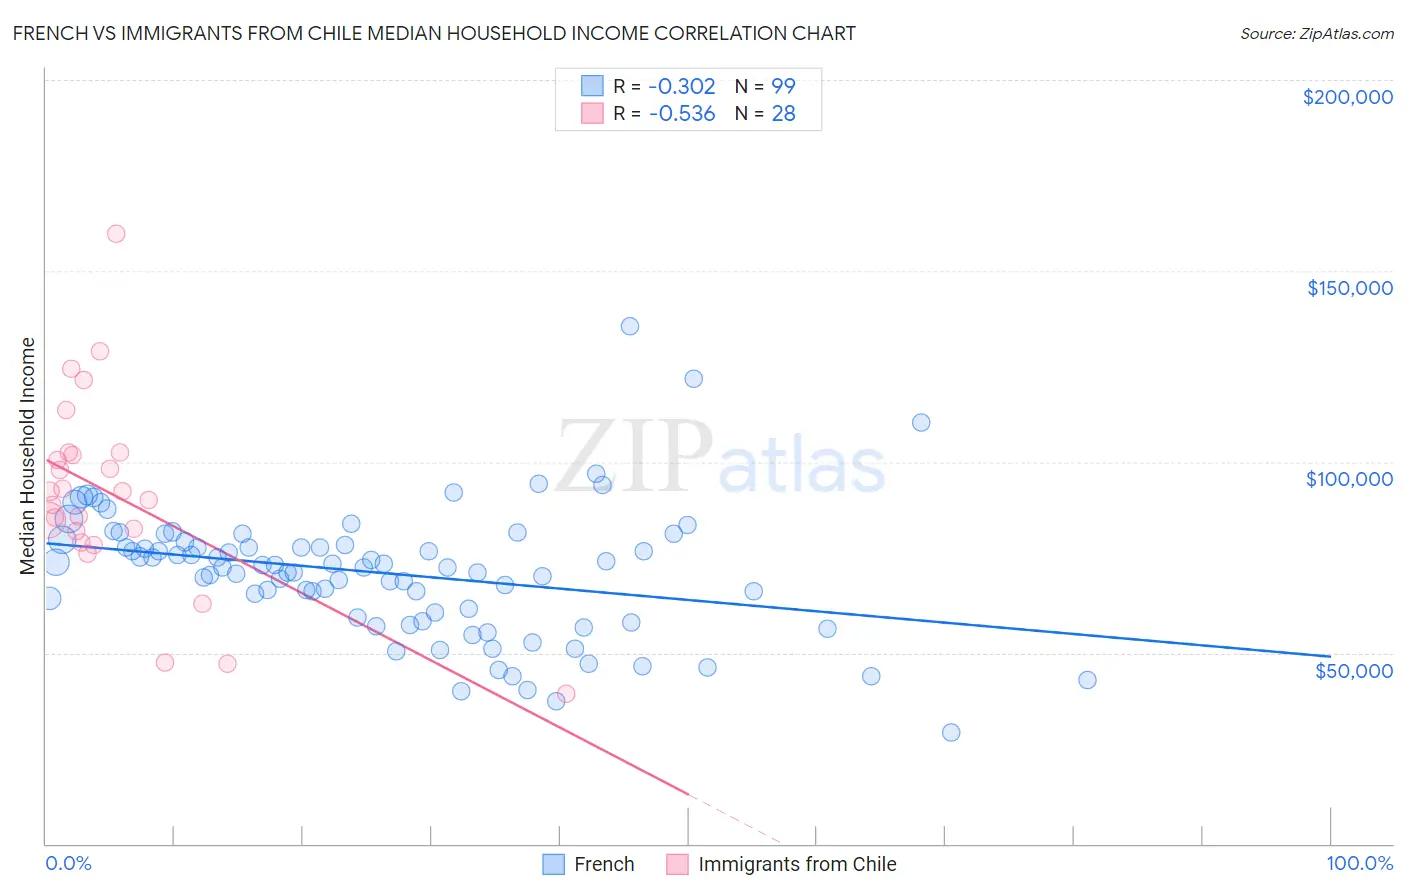
French vs Immigrants from Chile Median Household Income Correlation Chart
The statistical analysis conducted on geographies consisting of 571,286,063 people shows a mild negative correlation between the proportion of French and median household income in the United States with a correlation coefficient (R) of -0.302 and weighted average of $83,468. Similarly, the statistical analysis conducted on geographies consisting of 218,579,752 people shows a substantial negative correlation between the proportion of Immigrants from Chile and median household income in the United States with a correlation coefficient (R) of -0.536 and weighted average of $88,388, a difference of 5.9%.
Median Household Income Correlation Summary
| Measurement | French | Immigrants from Chile |
| Minimum | $29,263 | $39,375 |
| Maximum | $135,625 | $159,688 |
| Range | $106,362 | $120,313 |
| Mean | $70,877 | $91,361 |
| Median | $72,372 | $91,251 |
| Interquartile 25% (IQ1) | $59,090 | $80,247 |
| Interquartile 75% (IQ3) | $79,064 | $102,116 |
| Interquartile Range (IQR) | $19,974 | $21,868 |
| Standard Deviation (Sample) | $17,004 | $25,347 |
| Standard Deviation (Population) | $16,918 | $24,890 |
Similar Demographics by Median Household Income
Demographics Similar to French by Median Household Income
In terms of median household income, the demographic groups most similar to French are Aleut ($83,446, a difference of 0.030%), Japanese ($83,395, a difference of 0.090%), Immigrants from Armenia ($83,555, a difference of 0.10%), German ($83,358, a difference of 0.13%), and Ghanaian ($83,582, a difference of 0.14%).
| Demographics | Rating | Rank | Median Household Income |
| Immigrants | Colombia | 31.7 /100 | #189 | Fair $83,902 |
| Slovaks | 30.2 /100 | #190 | Fair $83,798 |
| Iraqis | 29.6 /100 | #191 | Fair $83,753 |
| Welsh | 28.0 /100 | #192 | Fair $83,628 |
| Finns | 27.7 /100 | #193 | Fair $83,607 |
| Ghanaians | 27.4 /100 | #194 | Fair $83,582 |
| Immigrants | Armenia | 27.0 /100 | #195 | Fair $83,555 |
| French | 26.0 /100 | #196 | Fair $83,468 |
| Aleuts | 25.7 /100 | #197 | Fair $83,446 |
| Japanese | 25.1 /100 | #198 | Fair $83,395 |
| Germans | 24.6 /100 | #199 | Fair $83,358 |
| Tsimshian | 24.5 /100 | #200 | Fair $83,346 |
| Spanish | 24.4 /100 | #201 | Fair $83,343 |
| Immigrants | Thailand | 24.3 /100 | #202 | Fair $83,327 |
| Immigrants | Cambodia | 24.0 /100 | #203 | Fair $83,304 |
Demographics Similar to Immigrants from Chile by Median Household Income
In terms of median household income, the demographic groups most similar to Immigrants from Chile are Arab ($88,398, a difference of 0.010%), Sierra Leonean ($88,463, a difference of 0.080%), Polish ($88,472, a difference of 0.090%), Immigrants from Sierra Leone ($88,498, a difference of 0.12%), and Swedish ($88,524, a difference of 0.15%).
| Demographics | Rating | Rank | Median Household Income |
| Europeans | 91.2 /100 | #132 | Exceptional $88,751 |
| Immigrants | Ethiopia | 90.9 /100 | #133 | Exceptional $88,687 |
| Swedes | 90.0 /100 | #134 | Exceptional $88,524 |
| Immigrants | Sierra Leone | 89.9 /100 | #135 | Excellent $88,498 |
| Poles | 89.7 /100 | #136 | Excellent $88,472 |
| Sierra Leoneans | 89.6 /100 | #137 | Excellent $88,463 |
| Arabs | 89.2 /100 | #138 | Excellent $88,398 |
| Immigrants | Chile | 89.2 /100 | #139 | Excellent $88,388 |
| Lebanese | 87.2 /100 | #140 | Excellent $88,091 |
| Immigrants | Morocco | 86.0 /100 | #141 | Excellent $87,930 |
| Canadians | 84.7 /100 | #142 | Excellent $87,769 |
| Danes | 83.9 /100 | #143 | Excellent $87,676 |
| Serbians | 83.0 /100 | #144 | Excellent $87,572 |
| Ugandans | 82.9 /100 | #145 | Excellent $87,557 |
| Immigrants | Uganda | 82.8 /100 | #146 | Excellent $87,553 |