French vs Cambodian Per Capita Income
COMPARE
French
Cambodian
Per Capita Income
Per Capita Income Comparison
French
Cambodians
$43,685
PER CAPITA INCOME
50.7/ 100
METRIC RATING
173rd/ 347
METRIC RANK
$51,731
PER CAPITA INCOME
100.0/ 100
METRIC RATING
39th/ 347
METRIC RANK
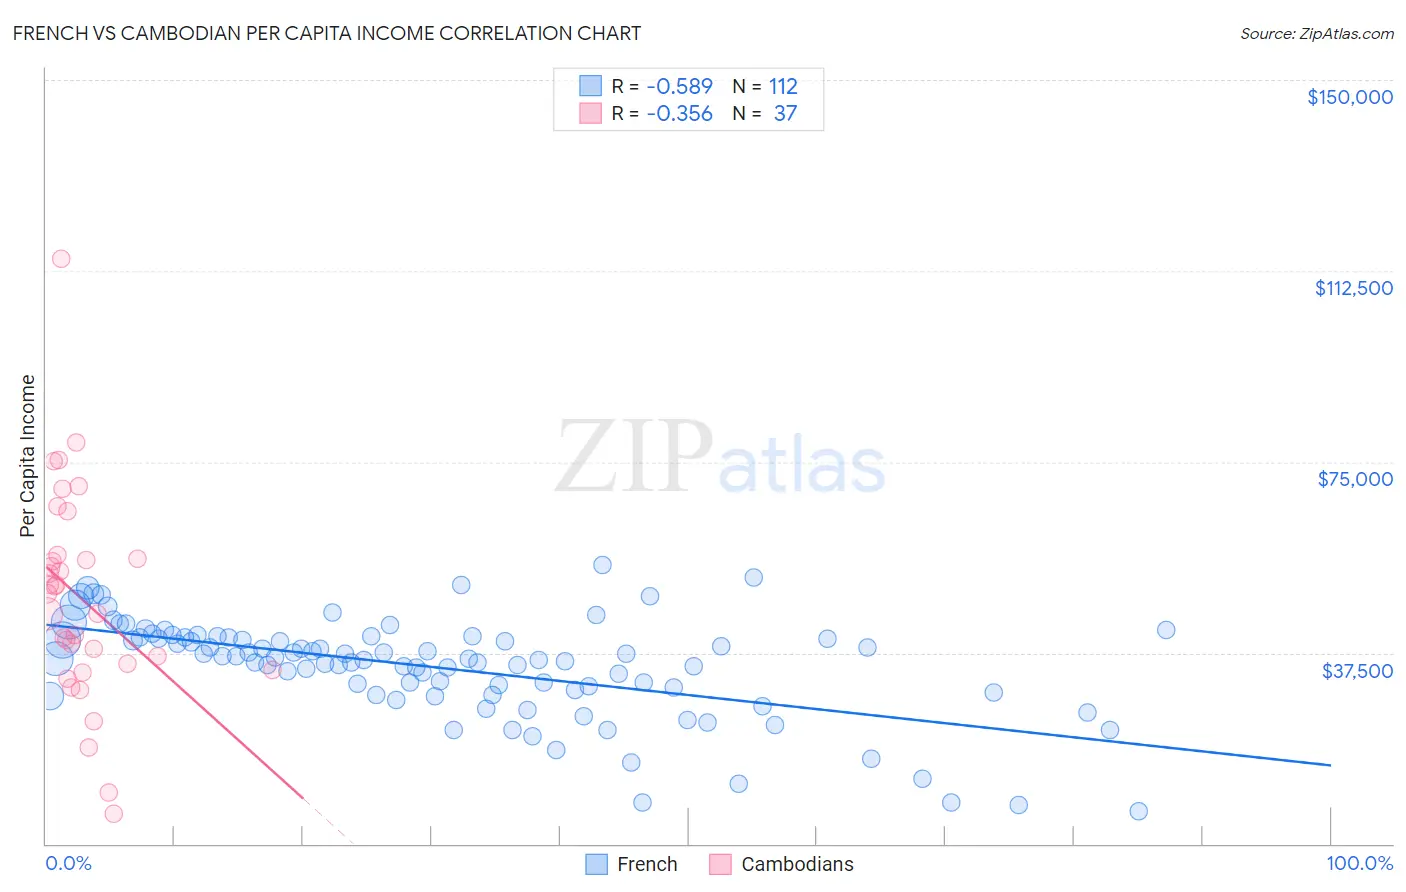
French vs Cambodian Per Capita Income Correlation Chart
The statistical analysis conducted on geographies consisting of 572,484,193 people shows a substantial negative correlation between the proportion of French and per capita income in the United States with a correlation coefficient (R) of -0.589 and weighted average of $43,685. Similarly, the statistical analysis conducted on geographies consisting of 102,519,941 people shows a mild negative correlation between the proportion of Cambodians and per capita income in the United States with a correlation coefficient (R) of -0.356 and weighted average of $51,731, a difference of 18.4%.
Per Capita Income Correlation Summary
| Measurement | French | Cambodian |
| Minimum | $6,335 | $5,866 |
| Maximum | $54,853 | $114,830 |
| Range | $48,518 | $108,964 |
| Mean | $34,598 | $48,227 |
| Median | $36,348 | $49,059 |
| Interquartile 25% (IQ1) | $29,890 | $34,778 |
| Interquartile 75% (IQ3) | $40,437 | $56,350 |
| Interquartile Range (IQR) | $10,547 | $21,571 |
| Standard Deviation (Sample) | $9,750 | $20,684 |
| Standard Deviation (Population) | $9,706 | $20,403 |
Similar Demographics by Per Capita Income
Demographics Similar to French by Per Capita Income
In terms of per capita income, the demographic groups most similar to French are Colombian ($43,661, a difference of 0.060%), Celtic ($43,621, a difference of 0.15%), Czechoslovakian ($43,806, a difference of 0.28%), Immigrants from South Eastern Asia ($43,539, a difference of 0.34%), and Immigrants from Eastern Africa ($43,838, a difference of 0.35%).
| Demographics | Rating | Rank | Per Capita Income |
| Immigrants | Uruguay | 59.3 /100 | #166 | Average $43,997 |
| English | 58.9 /100 | #167 | Average $43,982 |
| Belgians | 58.1 /100 | #168 | Average $43,951 |
| Immigrants | Peru | 55.3 /100 | #169 | Average $43,852 |
| Scandinavians | 55.2 /100 | #170 | Average $43,848 |
| Immigrants | Eastern Africa | 54.9 /100 | #171 | Average $43,838 |
| Czechoslovakians | 54.1 /100 | #172 | Average $43,806 |
| French | 50.7 /100 | #173 | Average $43,685 |
| Colombians | 50.0 /100 | #174 | Average $43,661 |
| Celtics | 48.9 /100 | #175 | Average $43,621 |
| Immigrants | South Eastern Asia | 46.6 /100 | #176 | Average $43,539 |
| Tlingit-Haida | 45.9 /100 | #177 | Average $43,516 |
| Immigrants | Costa Rica | 44.5 /100 | #178 | Average $43,464 |
| Finns | 44.4 /100 | #179 | Average $43,461 |
| Sierra Leoneans | 42.9 /100 | #180 | Average $43,405 |
Demographics Similar to Cambodians by Per Capita Income
In terms of per capita income, the demographic groups most similar to Cambodians are Immigrants from Czechoslovakia ($51,770, a difference of 0.070%), Immigrants from Korea ($51,671, a difference of 0.12%), Estonian ($51,875, a difference of 0.28%), Immigrants from Greece ($51,891, a difference of 0.31%), and Immigrants from South Africa ($51,465, a difference of 0.52%).
| Demographics | Rating | Rank | Per Capita Income |
| Immigrants | Norway | 100.0 /100 | #32 | Exceptional $52,217 |
| Australians | 100.0 /100 | #33 | Exceptional $52,074 |
| Immigrants | Russia | 100.0 /100 | #34 | Exceptional $52,044 |
| Burmese | 100.0 /100 | #35 | Exceptional $52,005 |
| Immigrants | Greece | 100.0 /100 | #36 | Exceptional $51,891 |
| Estonians | 100.0 /100 | #37 | Exceptional $51,875 |
| Immigrants | Czechoslovakia | 100.0 /100 | #38 | Exceptional $51,770 |
| Cambodians | 100.0 /100 | #39 | Exceptional $51,731 |
| Immigrants | Korea | 100.0 /100 | #40 | Exceptional $51,671 |
| Immigrants | South Africa | 100.0 /100 | #41 | Exceptional $51,465 |
| Immigrants | Turkey | 100.0 /100 | #42 | Exceptional $51,368 |
| Immigrants | Lithuania | 100.0 /100 | #43 | Exceptional $51,361 |
| Immigrants | Europe | 100.0 /100 | #44 | Exceptional $50,950 |
| Immigrants | Spain | 100.0 /100 | #45 | Exceptional $50,933 |
| Immigrants | Latvia | 100.0 /100 | #46 | Exceptional $50,914 |