French Canadian vs Apache Median Female Earnings
COMPARE
French Canadian
Apache
Median Female Earnings
Median Female Earnings Comparison
French Canadians
Apache
$38,436
MEDIAN FEMALE EARNINGS
6.8/ 100
METRIC RATING
226th/ 347
METRIC RANK
$34,895
MEDIAN FEMALE EARNINGS
0.0/ 100
METRIC RATING
314th/ 347
METRIC RANK
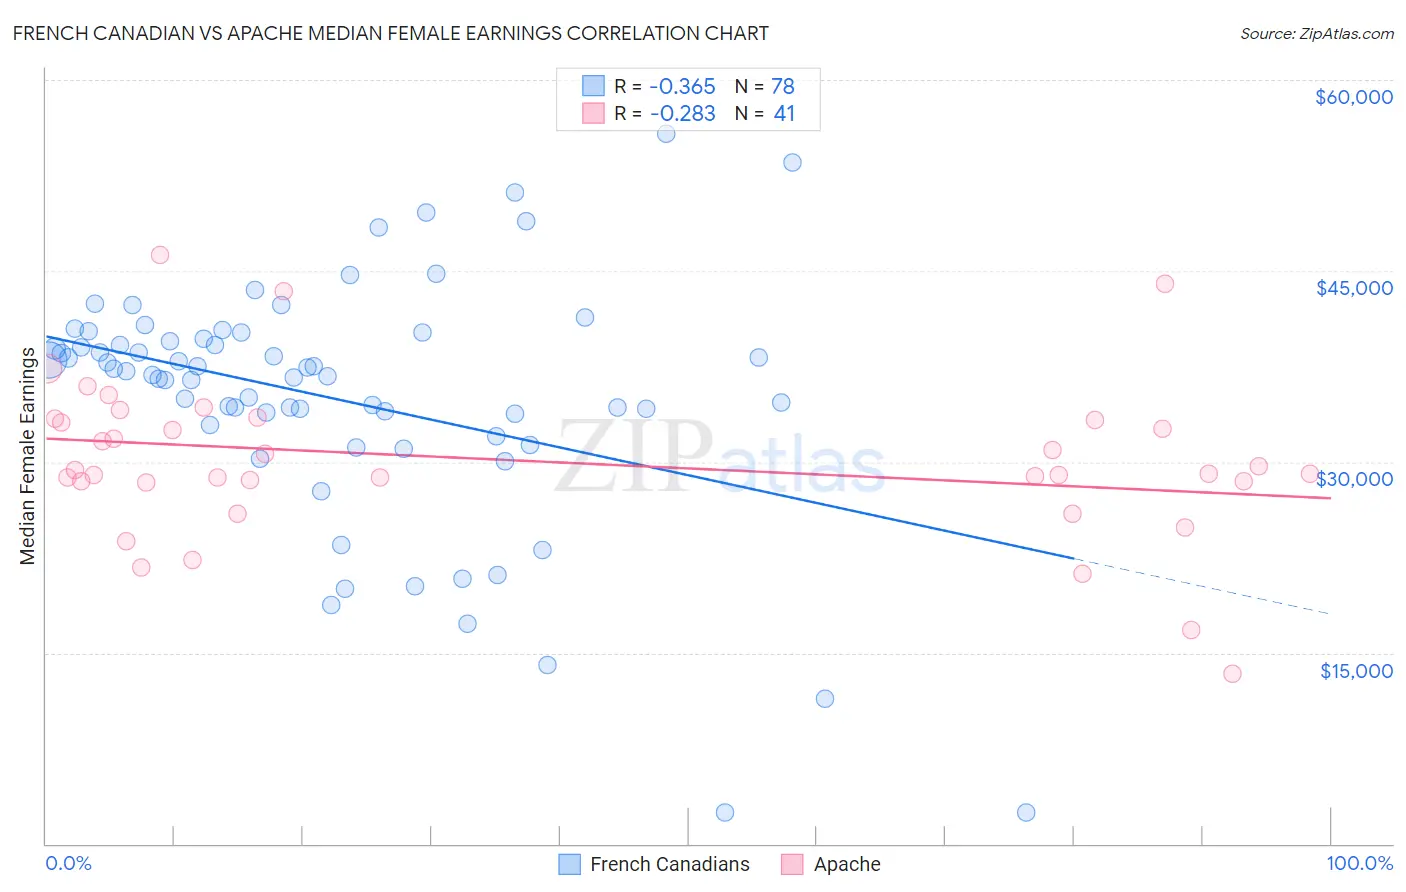
French Canadian vs Apache Median Female Earnings Correlation Chart
The statistical analysis conducted on geographies consisting of 502,023,623 people shows a mild negative correlation between the proportion of French Canadians and median female earnings in the United States with a correlation coefficient (R) of -0.365 and weighted average of $38,436. Similarly, the statistical analysis conducted on geographies consisting of 230,997,872 people shows a weak negative correlation between the proportion of Apache and median female earnings in the United States with a correlation coefficient (R) of -0.283 and weighted average of $34,895, a difference of 10.2%.
Median Female Earnings Correlation Summary
| Measurement | French Canadian | Apache |
| Minimum | $2,499 | $13,381 |
| Maximum | $55,750 | $46,250 |
| Range | $53,251 | $32,869 |
| Mean | $34,934 | $30,090 |
| Median | $37,008 | $29,044 |
| Interquartile 25% (IQ1) | $32,858 | $28,433 |
| Interquartile 75% (IQ3) | $39,682 | $33,369 |
| Interquartile Range (IQR) | $6,824 | $4,936 |
| Standard Deviation (Sample) | $9,847 | $6,387 |
| Standard Deviation (Population) | $9,784 | $6,309 |
Similar Demographics by Median Female Earnings
Demographics Similar to French Canadians by Median Female Earnings
In terms of median female earnings, the demographic groups most similar to French Canadians are French ($38,457, a difference of 0.050%), Native Hawaiian ($38,461, a difference of 0.060%), Scottish ($38,397, a difference of 0.10%), Subsaharan African ($38,391, a difference of 0.12%), and Belgian ($38,382, a difference of 0.14%).
| Demographics | Rating | Rank | Median Female Earnings |
| Nepalese | 9.3 /100 | #219 | Tragic $38,603 |
| Yugoslavians | 8.8 /100 | #220 | Tragic $38,573 |
| Immigrants | Azores | 8.8 /100 | #221 | Tragic $38,573 |
| Japanese | 8.1 /100 | #222 | Tragic $38,528 |
| Immigrants | Sudan | 7.8 /100 | #223 | Tragic $38,511 |
| Native Hawaiians | 7.1 /100 | #224 | Tragic $38,461 |
| French | 7.0 /100 | #225 | Tragic $38,457 |
| French Canadians | 6.8 /100 | #226 | Tragic $38,436 |
| Scottish | 6.3 /100 | #227 | Tragic $38,397 |
| Sub-Saharan Africans | 6.2 /100 | #228 | Tragic $38,391 |
| Belgians | 6.1 /100 | #229 | Tragic $38,382 |
| Basques | 5.7 /100 | #230 | Tragic $38,352 |
| Somalis | 5.5 /100 | #231 | Tragic $38,333 |
| Scandinavians | 5.2 /100 | #232 | Tragic $38,306 |
| Tongans | 5.1 /100 | #233 | Tragic $38,288 |
Demographics Similar to Apache by Median Female Earnings
In terms of median female earnings, the demographic groups most similar to Apache are Cuban ($34,942, a difference of 0.13%), Yaqui ($34,943, a difference of 0.14%), Ute ($34,960, a difference of 0.19%), Pennsylvania German ($34,802, a difference of 0.27%), and Chippewa ($35,003, a difference of 0.31%).
| Demographics | Rating | Rank | Median Female Earnings |
| Sioux | 0.0 /100 | #307 | Tragic $35,063 |
| Immigrants | Bahamas | 0.0 /100 | #308 | Tragic $35,027 |
| Hondurans | 0.0 /100 | #309 | Tragic $35,013 |
| Chippewa | 0.0 /100 | #310 | Tragic $35,003 |
| Ute | 0.0 /100 | #311 | Tragic $34,960 |
| Yaqui | 0.0 /100 | #312 | Tragic $34,943 |
| Cubans | 0.0 /100 | #313 | Tragic $34,942 |
| Apache | 0.0 /100 | #314 | Tragic $34,895 |
| Pennsylvania Germans | 0.0 /100 | #315 | Tragic $34,802 |
| Cherokee | 0.0 /100 | #316 | Tragic $34,742 |
| Potawatomi | 0.0 /100 | #317 | Tragic $34,739 |
| Immigrants | Yemen | 0.0 /100 | #318 | Tragic $34,693 |
| Shoshone | 0.0 /100 | #319 | Tragic $34,677 |
| Immigrants | Honduras | 0.0 /100 | #320 | Tragic $34,647 |
| Hispanics or Latinos | 0.0 /100 | #321 | Tragic $34,421 |