French American Indian vs Immigrants from Moldova Per Capita Income
COMPARE
French American Indian
Immigrants from Moldova
Per Capita Income
Per Capita Income Comparison
French American Indians
Immigrants from Moldova
$40,244
PER CAPITA INCOME
2.1/ 100
METRIC RATING
244th/ 347
METRIC RANK
$47,489
PER CAPITA INCOME
98.7/ 100
METRIC RATING
92nd/ 347
METRIC RANK
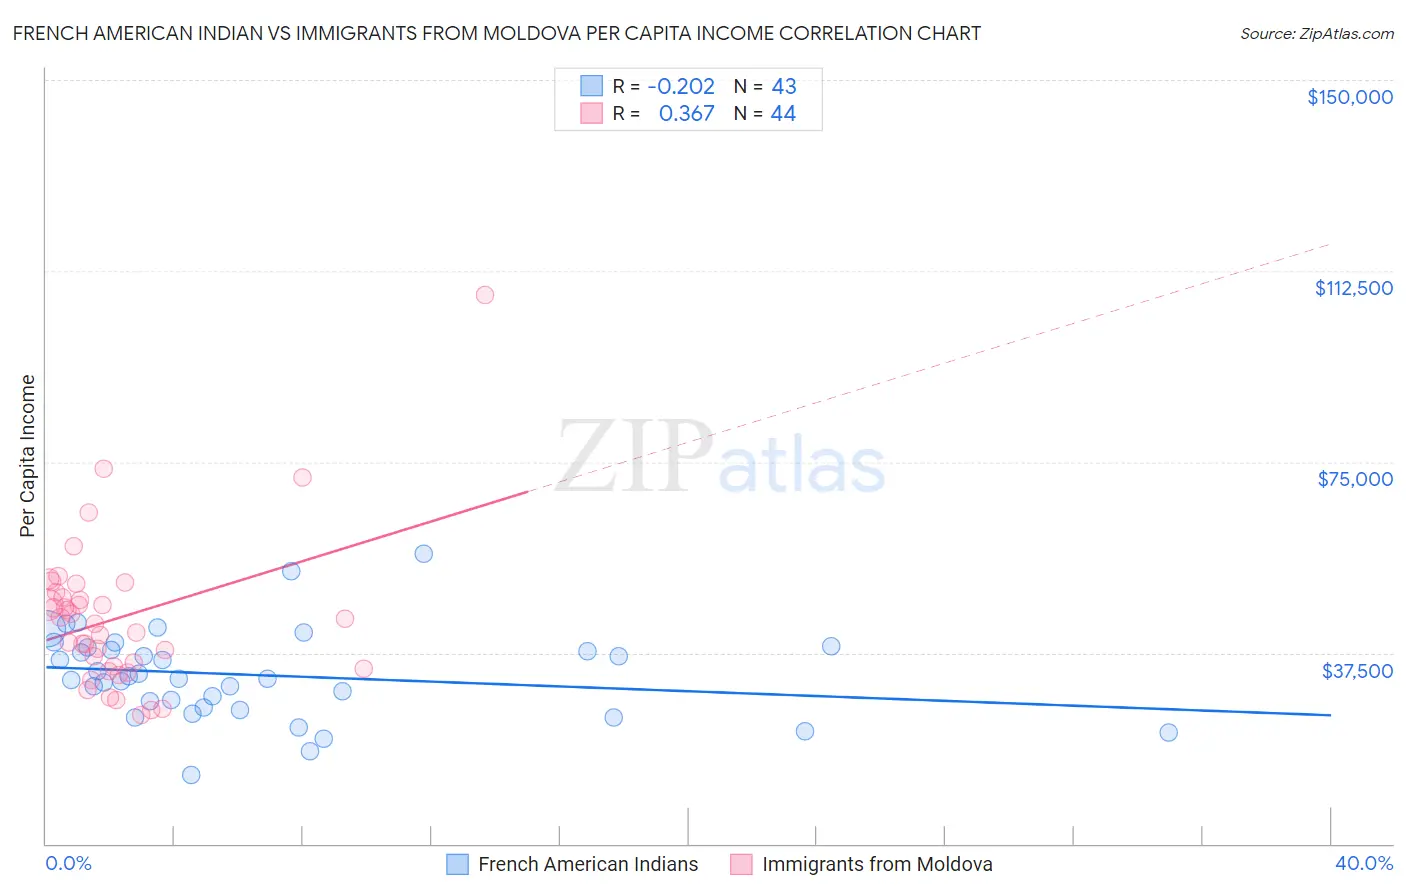
French American Indian vs Immigrants from Moldova Per Capita Income Correlation Chart
The statistical analysis conducted on geographies consisting of 131,975,147 people shows a weak negative correlation between the proportion of French American Indians and per capita income in the United States with a correlation coefficient (R) of -0.202 and weighted average of $40,244. Similarly, the statistical analysis conducted on geographies consisting of 124,402,409 people shows a mild positive correlation between the proportion of Immigrants from Moldova and per capita income in the United States with a correlation coefficient (R) of 0.367 and weighted average of $47,489, a difference of 18.0%.
Per Capita Income Correlation Summary
| Measurement | French American Indian | Immigrants from Moldova |
| Minimum | $13,560 | $25,195 |
| Maximum | $57,062 | $107,889 |
| Range | $43,502 | $82,694 |
| Mean | $33,133 | $44,404 |
| Median | $32,489 | $43,721 |
| Interquartile 25% (IQ1) | $26,698 | $34,656 |
| Interquartile 75% (IQ3) | $38,474 | $48,923 |
| Interquartile Range (IQR) | $11,776 | $14,267 |
| Standard Deviation (Sample) | $8,715 | $14,744 |
| Standard Deviation (Population) | $8,613 | $14,575 |
Similar Demographics by Per Capita Income
Demographics Similar to French American Indians by Per Capita Income
In terms of per capita income, the demographic groups most similar to French American Indians are German Russian ($40,266, a difference of 0.060%), Immigrants from Western Africa ($40,294, a difference of 0.13%), British West Indian ($40,330, a difference of 0.21%), Subsaharan African ($40,152, a difference of 0.23%), and Immigrants from Nigeria ($40,339, a difference of 0.24%).
| Demographics | Rating | Rank | Per Capita Income |
| Immigrants | Cambodia | 2.6 /100 | #237 | Tragic $40,434 |
| Somalis | 2.4 /100 | #238 | Tragic $40,367 |
| Tsimshian | 2.4 /100 | #239 | Tragic $40,344 |
| Immigrants | Nigeria | 2.3 /100 | #240 | Tragic $40,339 |
| British West Indians | 2.3 /100 | #241 | Tragic $40,330 |
| Immigrants | Western Africa | 2.2 /100 | #242 | Tragic $40,294 |
| German Russians | 2.2 /100 | #243 | Tragic $40,266 |
| French American Indians | 2.1 /100 | #244 | Tragic $40,244 |
| Sub-Saharan Africans | 1.9 /100 | #245 | Tragic $40,152 |
| Cree | 1.7 /100 | #246 | Tragic $40,056 |
| Immigrants | Somalia | 1.6 /100 | #247 | Tragic $39,974 |
| Cape Verdeans | 1.5 /100 | #248 | Tragic $39,935 |
| Japanese | 1.4 /100 | #249 | Tragic $39,870 |
| Immigrants | Burma/Myanmar | 1.3 /100 | #250 | Tragic $39,827 |
| Samoans | 1.3 /100 | #251 | Tragic $39,826 |
Demographics Similar to Immigrants from Moldova by Per Capita Income
In terms of per capita income, the demographic groups most similar to Immigrants from Moldova are Italian ($47,574, a difference of 0.18%), Macedonian ($47,573, a difference of 0.18%), Immigrants from Zimbabwe ($47,394, a difference of 0.20%), Albanian ($47,379, a difference of 0.23%), and Immigrants from Egypt ($47,361, a difference of 0.27%).
| Demographics | Rating | Rank | Per Capita Income |
| Austrians | 99.3 /100 | #85 | Exceptional $48,116 |
| Immigrants | Southern Europe | 99.3 /100 | #86 | Exceptional $48,027 |
| Ukrainians | 99.3 /100 | #87 | Exceptional $48,014 |
| Croatians | 99.0 /100 | #88 | Exceptional $47,742 |
| Northern Europeans | 98.9 /100 | #89 | Exceptional $47,698 |
| Italians | 98.8 /100 | #90 | Exceptional $47,574 |
| Macedonians | 98.8 /100 | #91 | Exceptional $47,573 |
| Immigrants | Moldova | 98.7 /100 | #92 | Exceptional $47,489 |
| Immigrants | Zimbabwe | 98.5 /100 | #93 | Exceptional $47,394 |
| Albanians | 98.5 /100 | #94 | Exceptional $47,379 |
| Immigrants | Egypt | 98.5 /100 | #95 | Exceptional $47,361 |
| Alsatians | 98.3 /100 | #96 | Exceptional $47,284 |
| Carpatho Rusyns | 98.2 /100 | #97 | Exceptional $47,248 |
| Immigrants | Pakistan | 97.9 /100 | #98 | Exceptional $47,084 |
| Laotians | 97.8 /100 | #99 | Exceptional $47,041 |