French American Indian vs Ecuadorian Householder Income Under 25 years

COMPARE

French American Indian
Race
Ancestry
AfghanAfricanAlaska NativeAlaskan AthabascanAlbanianAleutAlsatianAmericanApacheArabArapahoArgentineanArmenianAssyrian/Chaldean/SyriacAustralianAustrianBahamianBangladeshiBarbadianBasqueBelgianBelizeanBermudanBhutaneseBlackfeetBolivianBrazilianBritishBritish West IndianBulgarianBurmeseCajunCambodianCanadianCape VerdeanCarpatho RusynCelticCentral AmericanCentral American IndianCherokeeCheyenneChickasawChileanChineseChippewaChoctawColombianColvilleComancheCosta RicanCreeCreekCroatianCrowCubanCypriotCzechCzechoslovakianDanishDelawareDominicanDutchDutch West IndianEastern EuropeanEgyptianEnglishEstonianEthiopianEuropeanFijianFilipinoFinnishFrenchFrench American IndianFrench CanadianGermanGerman RussianGhanaianGreekGuamanian/ChamorroGuatemalanGuyaneseHaitianHmongHonduranHopiHoumaHungarianIcelanderIndian (Asian)IndonesianInupiatIranianIraqiIrishIroquoisIsraeliItalianJamaicanJapaneseJordanianKenyanKiowaKoreanLaotianLatvianLebaneseLiberianLithuanianLumbeeLuxembourgerMacedonianMalaysianMalteseMarshalleseMenomineeMexicanMexican American IndianMongolianMoroccanNative HawaiianNavajoNepaleseNew ZealanderNicaraguanNigerianNorthern EuropeanNorwegianOkinawanOsageOttawaPaiutePakistaniPalestinianPanamanianParaguayanPennsylvania GermanPeruvianPimaPolishPortuguesePotawatomiPuebloPuerto RicanPuget Sound SalishRomanianRussianSalvadoranSamoanScandinavianScotch-IrishScottishSeminoleSenegaleseSerbianShoshoneSierra LeoneanSiouxSlavicSlovakSloveneSomaliSouth AfricanSouth AmericanSouth American IndianSoviet UnionSpaniardSpanishSpanish AmericanSpanish American IndianSri LankanSubsaharan AfricanSudaneseSwedishSwissSyrianTaiwaneseThaiTlingit-HaidaTohono O'OdhamTonganTrinidadian and TobagonianTsimshianTurkishU.S. Virgin IslanderUgandanUkrainianUruguayanUteVenezuelanVietnameseWelshWest IndianYakamaYaquiYugoslavianYumanYup'ikZimbabwean
Immigration
NonimmigrantsImmigrantsAfghanistanAfricaAlbaniaArgentinaArmeniaAsiaAustraliaAustriaBahamasBangladeshBarbadosBelarusBelgiumBelizeBoliviaBosnia and HerzegovinaBrazilBulgariaBurma/MyanmarCabo VerdeCambodiaCameroonCanadaCaribbeanCentral AmericaChileChinaColombiaCongoCosta RicaCroatiaCubaCzechoslovakiaDenmarkDominicaDominican RepublicEastern AfricaEastern AsiaEastern EuropeEcuadorEgyptEl SalvadorEnglandEritreaEthiopiaEuropeFijiFranceGermanyGhanaGreeceGrenadaGuatemalaGuyanaHaitiHondurasHong KongHungaryIndiaIndonesiaIranIraqIrelandIsraelItalyJamaicaJapanJordanKazakhstanKenyaKoreaKuwaitLaosLatin AmericaLatviaLebanonLiberiaLithuaniaMalaysiaMexicoMicronesiaMiddle AfricaMoldovaMoroccoNepalNetherlandsNicaraguaNigeriaNorth AmericaNorth MacedoniaNorthern AfricaNorthern EuropeNorwayOceaniaPakistanPanamaPeruPhilippinesPolandPortugalRomaniaRussiaSaudi ArabiaScotlandSenegalSerbiaSierra LeoneSingaporeSomaliaSouth AfricaSouth AmericaSouth Central AsiaSouth Eastern AsiaSouthern EuropeSpainSri LankaSt. Vincent and the GrenadinesSudanSwedenSwitzerlandSyriaTaiwanThailandTrinidad and TobagoTurkeyUgandaUkraineUruguayUzbekistanVenezuelaVietnamWest IndiesWestern AfricaWestern AsiaWestern EuropeYemenZaireZimbabweAzores
Ecuadorian
Race
Ancestry
AfghanAfricanAlaska NativeAlaskan AthabascanAlbanianAleutAlsatianAmericanApacheArabArapahoArgentineanArmenianAssyrian/Chaldean/SyriacAustralianAustrianBahamianBangladeshiBarbadianBasqueBelgianBelizeanBermudanBhutaneseBlackfeetBolivianBrazilianBritishBritish West IndianBulgarianBurmeseCajunCambodianCanadianCape VerdeanCarpatho RusynCelticCentral AmericanCentral American IndianCherokeeCheyenneChickasawChileanChineseChippewaChoctawColombianColvilleComancheCosta RicanCreeCreekCroatianCrowCubanCypriotCzechCzechoslovakianDanishDelawareDominicanDutchDutch West IndianEastern EuropeanEcuadorianEgyptianEnglishEstonianEthiopianEuropeanFijianFilipinoFinnishFrenchFrench CanadianGermanGerman RussianGhanaianGreekGuamanian/ChamorroGuatemalanGuyaneseHaitianHmongHonduranHopiHoumaHungarianIcelanderIndian (Asian)IndonesianInupiatIranianIraqiIrishIroquoisIsraeliItalianJamaicanJapaneseJordanianKenyanKiowaKoreanLaotianLatvianLebaneseLiberianLithuanianLumbeeLuxembourgerMacedonianMalaysianMalteseMarshalleseMenomineeMexicanMexican American IndianMongolianMoroccanNative HawaiianNavajoNepaleseNew ZealanderNicaraguanNigerianNorthern EuropeanNorwegianOkinawanOsageOttawaPaiutePakistaniPalestinianPanamanianParaguayanPennsylvania GermanPeruvianPimaPolishPortuguesePotawatomiPuebloPuerto RicanPuget Sound SalishRomanianRussianSalvadoranSamoanScandinavianScotch-IrishScottishSeminoleSenegaleseSerbianShoshoneSierra LeoneanSiouxSlavicSlovakSloveneSomaliSouth AfricanSouth AmericanSouth American IndianSoviet UnionSpaniardSpanishSpanish AmericanSpanish American IndianSri LankanSubsaharan AfricanSudaneseSwedishSwissSyrianTaiwaneseThaiTlingit-HaidaTohono O'OdhamTonganTrinidadian and TobagonianTsimshianTurkishU.S. Virgin IslanderUgandanUkrainianUruguayanUteVenezuelanVietnameseWelshWest IndianYakamaYaquiYugoslavianYumanYup'ikZimbabwean
Immigration
NonimmigrantsImmigrantsAfghanistanAfricaAlbaniaArgentinaArmeniaAsiaAustraliaAustriaBahamasBangladeshBarbadosBelarusBelgiumBelizeBoliviaBosnia and HerzegovinaBrazilBulgariaBurma/MyanmarCabo VerdeCambodiaCameroonCanadaCaribbeanCentral AmericaChileChinaColombiaCongoCosta RicaCroatiaCubaCzechoslovakiaDenmarkDominicaDominican RepublicEastern AfricaEastern AsiaEastern EuropeEcuadorEgyptEl SalvadorEnglandEritreaEthiopiaEuropeFijiFranceGermanyGhanaGreeceGrenadaGuatemalaGuyanaHaitiHondurasHong KongHungaryIndiaIndonesiaIranIraqIrelandIsraelItalyJamaicaJapanJordanKazakhstanKenyaKoreaKuwaitLaosLatin AmericaLatviaLebanonLiberiaLithuaniaMalaysiaMexicoMicronesiaMiddle AfricaMoldovaMoroccoNepalNetherlandsNicaraguaNigeriaNorth AmericaNorth MacedoniaNorthern AfricaNorthern EuropeNorwayOceaniaPakistanPanamaPeruPhilippinesPolandPortugalRomaniaRussiaSaudi ArabiaScotlandSenegalSerbiaSierra LeoneSingaporeSomaliaSouth AfricaSouth AmericaSouth Central AsiaSouth Eastern AsiaSouthern EuropeSpainSri LankaSt. Vincent and the GrenadinesSudanSwedenSwitzerlandSyriaTaiwanThailandTrinidad and TobagoTurkeyUgandaUkraineUruguayUzbekistanVenezuelaVietnamWest IndiesWestern AfricaWestern AsiaWestern EuropeYemenZaireZimbabweAzores
Householder Income Under 25 years
Income
Poverty
Unemployment
Labor Participation
Family Structure
Vehicle Availability
Education Level
Disability

Householder Income Under 25 years Comparison

French American Indians

Ecuadorians

Tragic
Exceptional
$48,977
HOUSEHOLDER INCOME UNDER 25 YEARS
0.0/ 100
METRIC RATING
286th/ 347
METRIC RANK
$53,911
HOUSEHOLDER INCOME UNDER 25 YEARS
98.5/ 100
METRIC RATING
102nd/ 347
METRIC RANK

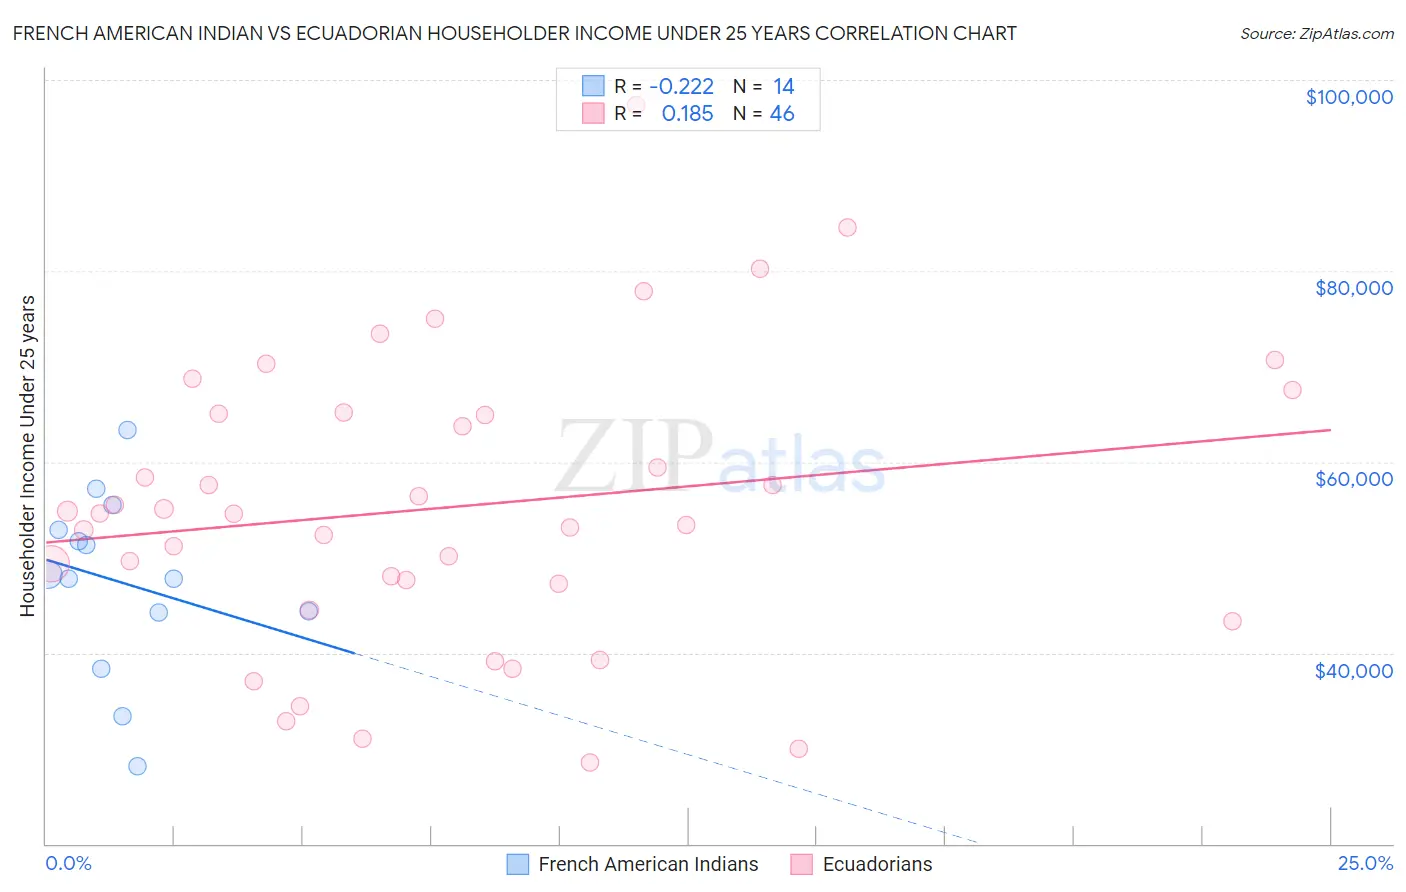
French American Indian vs Ecuadorian Householder Income Under 25 years Correlation Chart

The statistical analysis conducted on geographies consisting of 121,781,393 people shows a weak negative correlation between the proportion of French American Indians and household income with householder under the age of 25 in the United States with a correlation coefficient (R) of -0.222 and weighted average of $48,977. Similarly, the statistical analysis conducted on geographies consisting of 271,738,098 people shows a poor positive correlation between the proportion of Ecuadorians and household income with householder under the age of 25 in the United States with a correlation coefficient (R) of 0.185 and weighted average of $53,911, a difference of 10.1%.
French American Indian vs Ecuadorian Householder Income Under 25 years

Householder Income Under 25 years Correlation Summary

MeasurementFrench American IndianEcuadorian
Minimum$28,139$28,576
Maximum$63,296$97,399
Range$35,157$68,823
Mean$47,414$55,256
Median$47,997$54,589
Interquartile 25% (IQ1)$44,202$47,259
Interquartile 75% (IQ3)$52,866$65,102
Interquartile Range (IQR)$8,663$17,843
Standard Deviation (Sample)$9,404$15,099
Standard Deviation (Population)$9,062$14,934

Similar Demographics by Householder Income Under 25 years

Demographics Similar to French American Indians by Householder Income Under 25 years

In terms of householder income under 25 years, the demographic groups most similar to French American Indians are Senegalese ($48,953, a difference of 0.050%), Liberian ($48,917, a difference of 0.12%), Scotch-Irish ($49,039, a difference of 0.13%), Honduran ($48,885, a difference of 0.19%), and American ($48,860, a difference of 0.24%).
DemographicsRating | RankHouseholder Income Under 25 years
Apache
0.1
/100
|
#279
Tragic
$49,395
Hmong
0.1
/100
|
#280
Tragic
$49,364
Immigrants | Nonimmigrants
0.1
/100
|
#281
Tragic
$49,348
Alsatians
0.1
/100
|
#282
Tragic
$49,267
Immigrants | Nigeria
0.1
/100
|
#283
Tragic
$49,174
Carpatho Rusyns
0.1
/100
|
#284
Tragic
$49,113
Scotch-Irish
0.0
/100
|
#285
Tragic
$49,039
French American Indians
0.0
/100
|
#286
Tragic
$48,977
Senegalese
0.0
/100
|
#287
Tragic
$48,953
Liberians
0.0
/100
|
#288
Tragic
$48,917
Hondurans
0.0
/100
|
#289
Tragic
$48,885
Americans
0.0
/100
|
#290
Tragic
$48,860
Immigrants | Burma/Myanmar
0.0
/100
|
#291
Tragic
$48,749
Shoshone
0.0
/100
|
#292
Tragic
$48,720
Sub-Saharan Africans
0.0
/100
|
#293
Tragic
$48,691

Demographics Similar to Ecuadorians by Householder Income Under 25 years

In terms of householder income under 25 years, the demographic groups most similar to Ecuadorians are South American ($53,939, a difference of 0.050%), Ukrainian ($53,843, a difference of 0.13%), Immigrants from Kazakhstan ($53,990, a difference of 0.15%), Alaska Native ($54,000, a difference of 0.16%), and Ethiopian ($53,818, a difference of 0.17%).
DemographicsRating | RankHouseholder Income Under 25 years
Immigrants | Malaysia
99.2
/100
|
#95
Exceptional
$54,179
Argentineans
99.2
/100
|
#96
Exceptional
$54,154
Immigrants | Portugal
99.1
/100
|
#97
Exceptional
$54,105
Eastern Europeans
99.0
/100
|
#98
Exceptional
$54,066
Alaska Natives
98.8
/100
|
#99
Exceptional
$54,000
Immigrants | Kazakhstan
98.8
/100
|
#100
Exceptional
$53,990
South Americans
98.6
/100
|
#101
Exceptional
$53,939
Ecuadorians
98.5
/100
|
#102
Exceptional
$53,911
Ukrainians
98.3
/100
|
#103
Exceptional
$53,843
Ethiopians
98.2
/100
|
#104
Exceptional
$53,818
Immigrants | France
98.1
/100
|
#105
Exceptional
$53,805
Albanians
98.1
/100
|
#106
Exceptional
$53,794
Australians
97.8
/100
|
#107
Exceptional
$53,739
Maltese
97.8
/100
|
#108
Exceptional
$53,735
Immigrants | Ecuador
97.7
/100
|
#109
Exceptional
$53,722