Finnish vs Slavic Householder Income Under 25 years

COMPARE

Finnish
Race
Ancestry
AfghanAfricanAlaska NativeAlaskan AthabascanAlbanianAleutAlsatianAmericanApacheArabArapahoArgentineanArmenianAssyrian/Chaldean/SyriacAustralianAustrianBahamianBangladeshiBarbadianBasqueBelgianBelizeanBermudanBhutaneseBlackfeetBolivianBrazilianBritishBritish West IndianBulgarianBurmeseCajunCambodianCanadianCape VerdeanCarpatho RusynCelticCentral AmericanCentral American IndianCherokeeCheyenneChickasawChileanChineseChippewaChoctawColombianColvilleComancheCosta RicanCreeCreekCroatianCrowCubanCypriotCzechCzechoslovakianDanishDelawareDominicanDutchDutch West IndianEastern EuropeanEcuadorianEgyptianEnglishEstonianEthiopianEuropeanFijianFilipinoFinnishFrenchFrench American IndianFrench CanadianGermanGerman RussianGhanaianGreekGuamanian/ChamorroGuatemalanGuyaneseHaitianHmongHonduranHopiHoumaHungarianIcelanderIndian (Asian)IndonesianInupiatIranianIraqiIrishIroquoisIsraeliItalianJamaicanJapaneseJordanianKenyanKiowaKoreanLaotianLatvianLebaneseLiberianLithuanianLumbeeLuxembourgerMacedonianMalaysianMalteseMarshalleseMenomineeMexicanMexican American IndianMongolianMoroccanNative HawaiianNavajoNepaleseNew ZealanderNicaraguanNigerianNorthern EuropeanNorwegianOkinawanOsageOttawaPaiutePakistaniPalestinianPanamanianParaguayanPennsylvania GermanPeruvianPimaPolishPortuguesePotawatomiPuebloPuerto RicanPuget Sound SalishRomanianRussianSalvadoranSamoanScandinavianScotch-IrishScottishSeminoleSenegaleseSerbianShoshoneSierra LeoneanSiouxSlovakSloveneSomaliSouth AfricanSouth AmericanSouth American IndianSoviet UnionSpaniardSpanishSpanish AmericanSpanish American IndianSri LankanSubsaharan AfricanSudaneseSwedishSwissSyrianTaiwaneseThaiTlingit-HaidaTohono O'OdhamTonganTrinidadian and TobagonianTsimshianTurkishU.S. Virgin IslanderUgandanUkrainianUruguayanUteVenezuelanVietnameseWelshWest IndianYakamaYaquiYugoslavianYumanYup'ikZimbabwean
Immigration
NonimmigrantsImmigrantsAfghanistanAfricaAlbaniaArgentinaArmeniaAsiaAustraliaAustriaBahamasBangladeshBarbadosBelarusBelgiumBelizeBoliviaBosnia and HerzegovinaBrazilBulgariaBurma/MyanmarCabo VerdeCambodiaCameroonCanadaCaribbeanCentral AmericaChileChinaColombiaCongoCosta RicaCroatiaCubaCzechoslovakiaDenmarkDominicaDominican RepublicEastern AfricaEastern AsiaEastern EuropeEcuadorEgyptEl SalvadorEnglandEritreaEthiopiaEuropeFijiFranceGermanyGhanaGreeceGrenadaGuatemalaGuyanaHaitiHondurasHong KongHungaryIndiaIndonesiaIranIraqIrelandIsraelItalyJamaicaJapanJordanKazakhstanKenyaKoreaKuwaitLaosLatin AmericaLatviaLebanonLiberiaLithuaniaMalaysiaMexicoMicronesiaMiddle AfricaMoldovaMoroccoNepalNetherlandsNicaraguaNigeriaNorth AmericaNorth MacedoniaNorthern AfricaNorthern EuropeNorwayOceaniaPakistanPanamaPeruPhilippinesPolandPortugalRomaniaRussiaSaudi ArabiaScotlandSenegalSerbiaSierra LeoneSingaporeSomaliaSouth AfricaSouth AmericaSouth Central AsiaSouth Eastern AsiaSouthern EuropeSpainSri LankaSt. Vincent and the GrenadinesSudanSwedenSwitzerlandSyriaTaiwanThailandTrinidad and TobagoTurkeyUgandaUkraineUruguayUzbekistanVenezuelaVietnamWest IndiesWestern AfricaWestern AsiaWestern EuropeYemenZaireZimbabweAzores
Slavic
Race
Ancestry
AfghanAfricanAlaska NativeAlaskan AthabascanAlbanianAleutAlsatianAmericanApacheArabArapahoArgentineanArmenianAssyrian/Chaldean/SyriacAustralianAustrianBahamianBangladeshiBarbadianBasqueBelgianBelizeanBermudanBhutaneseBlackfeetBolivianBrazilianBritishBritish West IndianBulgarianBurmeseCajunCambodianCanadianCape VerdeanCarpatho RusynCelticCentral AmericanCentral American IndianCherokeeCheyenneChickasawChileanChineseChippewaChoctawColombianColvilleComancheCosta RicanCreeCreekCroatianCrowCubanCypriotCzechCzechoslovakianDanishDelawareDominicanDutchDutch West IndianEastern EuropeanEcuadorianEgyptianEnglishEstonianEthiopianEuropeanFijianFilipinoFrenchFrench American IndianFrench CanadianGermanGerman RussianGhanaianGreekGuamanian/ChamorroGuatemalanGuyaneseHaitianHmongHonduranHopiHoumaHungarianIcelanderIndian (Asian)IndonesianInupiatIranianIraqiIrishIroquoisIsraeliItalianJamaicanJapaneseJordanianKenyanKiowaKoreanLaotianLatvianLebaneseLiberianLithuanianLumbeeLuxembourgerMacedonianMalaysianMalteseMarshalleseMenomineeMexicanMexican American IndianMongolianMoroccanNative HawaiianNavajoNepaleseNew ZealanderNicaraguanNigerianNorthern EuropeanNorwegianOkinawanOsageOttawaPaiutePakistaniPalestinianPanamanianParaguayanPennsylvania GermanPeruvianPimaPolishPortuguesePotawatomiPuebloPuerto RicanPuget Sound SalishRomanianRussianSalvadoranSamoanScandinavianScotch-IrishScottishSeminoleSenegaleseSerbianShoshoneSierra LeoneanSiouxSlavicSlovakSloveneSomaliSouth AfricanSouth AmericanSouth American IndianSoviet UnionSpaniardSpanishSpanish AmericanSpanish American IndianSri LankanSubsaharan AfricanSudaneseSwedishSwissSyrianTaiwaneseThaiTlingit-HaidaTohono O'OdhamTonganTrinidadian and TobagonianTsimshianTurkishU.S. Virgin IslanderUgandanUkrainianUruguayanUteVenezuelanVietnameseWelshWest IndianYakamaYaquiYugoslavianYumanYup'ikZimbabwean
Immigration
NonimmigrantsImmigrantsAfghanistanAfricaAlbaniaArgentinaArmeniaAsiaAustraliaAustriaBahamasBangladeshBarbadosBelarusBelgiumBelizeBoliviaBosnia and HerzegovinaBrazilBulgariaBurma/MyanmarCabo VerdeCambodiaCameroonCanadaCaribbeanCentral AmericaChileChinaColombiaCongoCosta RicaCroatiaCubaCzechoslovakiaDenmarkDominicaDominican RepublicEastern AfricaEastern AsiaEastern EuropeEcuadorEgyptEl SalvadorEnglandEritreaEthiopiaEuropeFijiFranceGermanyGhanaGreeceGrenadaGuatemalaGuyanaHaitiHondurasHong KongHungaryIndiaIndonesiaIranIraqIrelandIsraelItalyJamaicaJapanJordanKazakhstanKenyaKoreaKuwaitLaosLatin AmericaLatviaLebanonLiberiaLithuaniaMalaysiaMexicoMicronesiaMiddle AfricaMoldovaMoroccoNepalNetherlandsNicaraguaNigeriaNorth AmericaNorth MacedoniaNorthern AfricaNorthern EuropeNorwayOceaniaPakistanPanamaPeruPhilippinesPolandPortugalRomaniaRussiaSaudi ArabiaScotlandSenegalSerbiaSierra LeoneSingaporeSomaliaSouth AfricaSouth AmericaSouth Central AsiaSouth Eastern AsiaSouthern EuropeSpainSri LankaSt. Vincent and the GrenadinesSudanSwedenSwitzerlandSyriaTaiwanThailandTrinidad and TobagoTurkeyUgandaUkraineUruguayUzbekistanVenezuelaVietnamWest IndiesWestern AfricaWestern AsiaWestern EuropeYemenZaireZimbabweAzores
Householder Income Under 25 years
Income
Poverty
Unemployment
Labor Participation
Family Structure
Vehicle Availability
Education Level
Disability

Householder Income Under 25 years Comparison

Finns

Slavs

Fair
Tragic
$51,827
HOUSEHOLDER INCOME UNDER 25 YEARS
29.2/ 100
METRIC RATING
178th/ 347
METRIC RANK
$50,563
HOUSEHOLDER INCOME UNDER 25 YEARS
1.8/ 100
METRIC RATING
248th/ 347
METRIC RANK

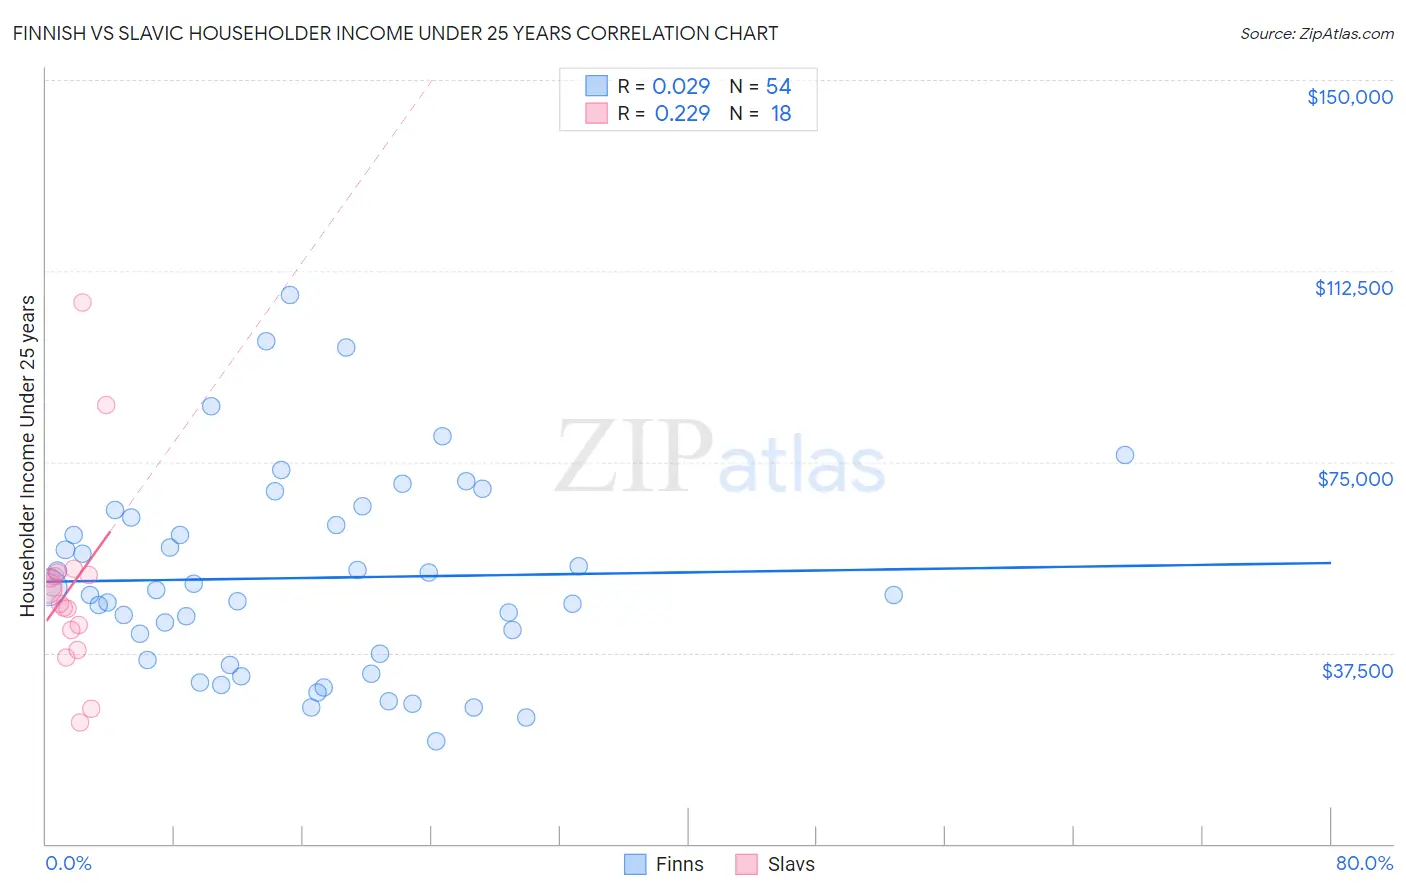
Finnish vs Slavic Householder Income Under 25 years Correlation Chart

The statistical analysis conducted on geographies consisting of 338,519,721 people shows no correlation between the proportion of Finns and household income with householder under the age of 25 in the United States with a correlation coefficient (R) of 0.029 and weighted average of $51,827. Similarly, the statistical analysis conducted on geographies consisting of 235,100,045 people shows a weak positive correlation between the proportion of Slavs and household income with householder under the age of 25 in the United States with a correlation coefficient (R) of 0.229 and weighted average of $50,563, a difference of 2.5%.
Finnish vs Slavic Householder Income Under 25 years

Householder Income Under 25 years Correlation Summary

MeasurementFinnishSlavic
Minimum$20,019$23,750
Maximum$107,709$106,250
Range$87,690$82,500
Mean$52,217$50,421
Median$49,349$48,652
Interquartile 25% (IQ1)$36,122$41,986
Interquartile 75% (IQ3)$63,954$52,857
Interquartile Range (IQR)$27,832$10,871
Standard Deviation (Sample)$19,708$19,147
Standard Deviation (Population)$19,525$18,607

Similar Demographics by Householder Income Under 25 years

Demographics Similar to Finns by Householder Income Under 25 years

In terms of householder income under 25 years, the demographic groups most similar to Finns are Basque ($51,818, a difference of 0.020%), Immigrants from England ($51,817, a difference of 0.020%), British West Indian ($51,844, a difference of 0.030%), European ($51,796, a difference of 0.060%), and Jordanian ($51,796, a difference of 0.060%).
DemographicsRating | RankHouseholder Income Under 25 years
Immigrants | Uruguay
56.8
/100
|
#171
Average
$52,302
Cypriots
51.2
/100
|
#172
Average
$52,209
Barbadians
50.8
/100
|
#173
Average
$52,202
Immigrants | Western Asia
50.0
/100
|
#174
Average
$52,190
Immigrants | Zimbabwe
33.8
/100
|
#175
Fair
$51,914
Austrians
32.9
/100
|
#176
Fair
$51,898
British West Indians
30.0
/100
|
#177
Fair
$51,844
Finns
29.2
/100
|
#178
Fair
$51,827
Basques
28.7
/100
|
#179
Fair
$51,818
Immigrants | England
28.7
/100
|
#180
Fair
$51,817
Europeans
27.6
/100
|
#181
Fair
$51,796
Jordanians
27.6
/100
|
#182
Fair
$51,796
Mexican American Indians
27.0
/100
|
#183
Fair
$51,783
Paiute
25.1
/100
|
#184
Fair
$51,743
Immigrants | Latvia
24.8
/100
|
#185
Fair
$51,737

Demographics Similar to Slavs by Householder Income Under 25 years

In terms of householder income under 25 years, the demographic groups most similar to Slavs are Immigrants from Bosnia and Herzegovina ($50,565, a difference of 0.0%), Scottish ($50,554, a difference of 0.020%), Welsh ($50,597, a difference of 0.070%), Immigrants from Africa ($50,609, a difference of 0.090%), and Immigrants from Cabo Verde ($50,520, a difference of 0.090%).
DemographicsRating | RankHouseholder Income Under 25 years
Immigrants | Micronesia
2.5
/100
|
#241
Tragic
$50,691
Cubans
2.3
/100
|
#242
Tragic
$50,655
Immigrants | Thailand
2.2
/100
|
#243
Tragic
$50,645
Marshallese
2.1
/100
|
#244
Tragic
$50,627
Immigrants | Africa
2.0
/100
|
#245
Tragic
$50,609
Welsh
2.0
/100
|
#246
Tragic
$50,597
Immigrants | Bosnia and Herzegovina
1.8
/100
|
#247
Tragic
$50,565
Slavs
1.8
/100
|
#248
Tragic
$50,563
Scottish
1.8
/100
|
#249
Tragic
$50,554
Immigrants | Cabo Verde
1.7
/100
|
#250
Tragic
$50,520
Celtics
1.4
/100
|
#251
Tragic
$50,447
Immigrants | Mexico
1.3
/100
|
#252
Tragic
$50,422
Immigrants | Haiti
1.2
/100
|
#253
Tragic
$50,398
Luxembourgers
1.2
/100
|
#254
Tragic
$50,379
Aleuts
1.2
/100
|
#255
Tragic
$50,377