European vs Laotian Per Capita Income
COMPARE
European
Laotian
Per Capita Income
Per Capita Income Comparison
Europeans
Laotians
$45,836
PER CAPITA INCOME
92.0/ 100
METRIC RATING
124th/ 347
METRIC RANK
$47,041
PER CAPITA INCOME
97.8/ 100
METRIC RATING
99th/ 347
METRIC RANK
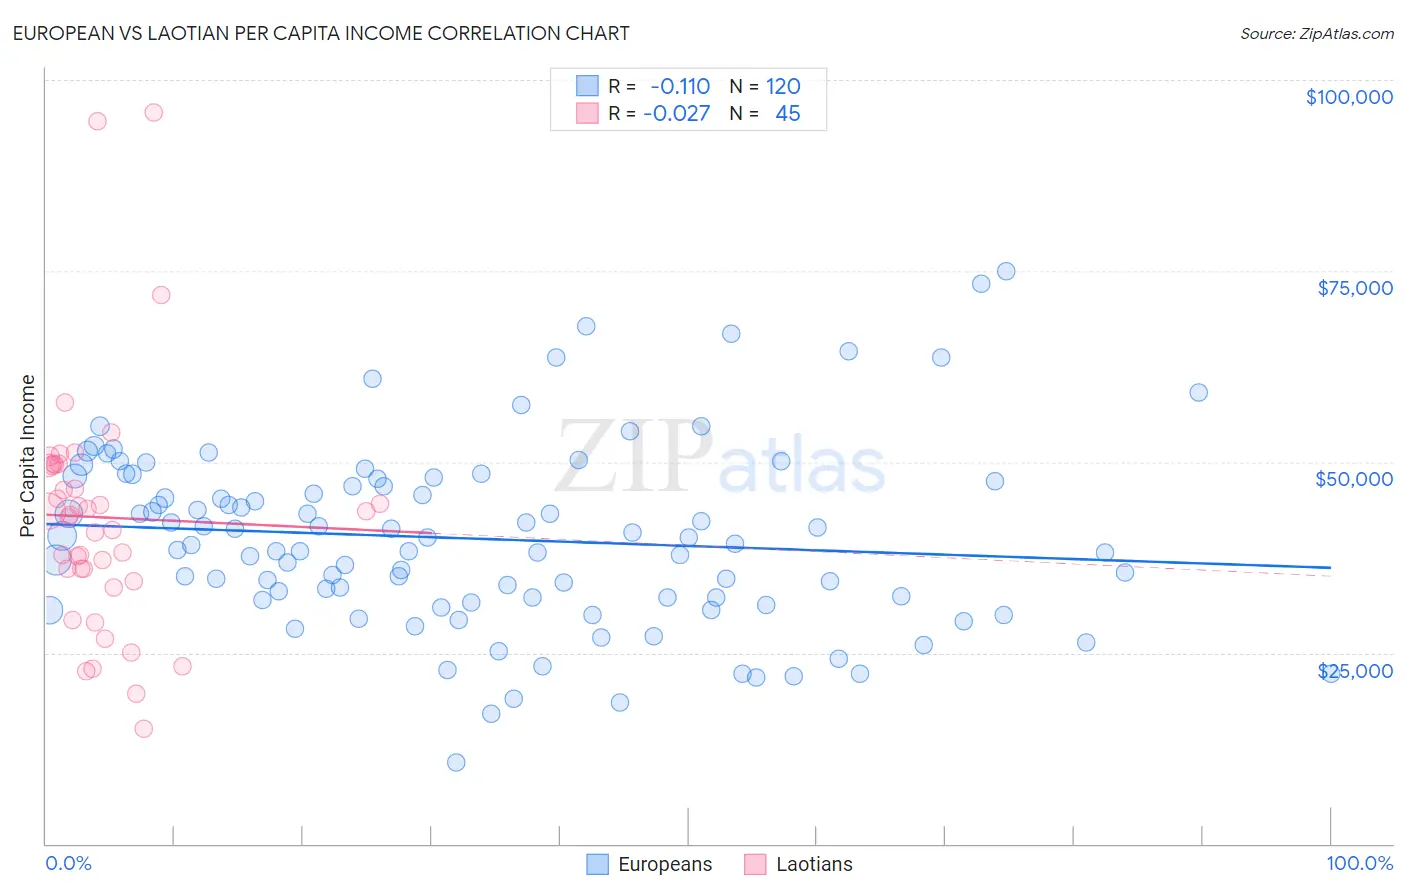
European vs Laotian Per Capita Income Correlation Chart
The statistical analysis conducted on geographies consisting of 561,881,498 people shows a poor negative correlation between the proportion of Europeans and per capita income in the United States with a correlation coefficient (R) of -0.110 and weighted average of $45,836. Similarly, the statistical analysis conducted on geographies consisting of 224,867,233 people shows no correlation between the proportion of Laotians and per capita income in the United States with a correlation coefficient (R) of -0.027 and weighted average of $47,041, a difference of 2.6%.
Per Capita Income Correlation Summary
| Measurement | European | Laotian |
| Minimum | $10,710 | $14,980 |
| Maximum | $74,913 | $95,805 |
| Range | $64,203 | $80,825 |
| Mean | $39,928 | $42,727 |
| Median | $39,188 | $43,043 |
| Interquartile 25% (IQ1) | $32,091 | $35,205 |
| Interquartile 75% (IQ3) | $47,667 | $49,592 |
| Interquartile Range (IQR) | $15,576 | $14,387 |
| Standard Deviation (Sample) | $11,966 | $15,836 |
| Standard Deviation (Population) | $11,916 | $15,659 |
Similar Demographics by Per Capita Income
Demographics Similar to Europeans by Per Capita Income
In terms of per capita income, the demographic groups most similar to Europeans are Lebanese ($45,840, a difference of 0.010%), Moroccan ($45,854, a difference of 0.040%), Canadian ($45,858, a difference of 0.050%), Zimbabwean ($45,804, a difference of 0.070%), and Palestinian ($45,790, a difference of 0.10%).
| Demographics | Rating | Rank | Per Capita Income |
| Chinese | 93.9 /100 | #117 | Exceptional $46,098 |
| Immigrants | Saudi Arabia | 93.3 /100 | #118 | Exceptional $46,008 |
| Immigrants | Poland | 93.1 /100 | #119 | Exceptional $45,979 |
| Immigrants | Ethiopia | 92.7 /100 | #120 | Exceptional $45,923 |
| Canadians | 92.2 /100 | #121 | Exceptional $45,858 |
| Moroccans | 92.1 /100 | #122 | Exceptional $45,854 |
| Lebanese | 92.0 /100 | #123 | Exceptional $45,840 |
| Europeans | 92.0 /100 | #124 | Exceptional $45,836 |
| Zimbabweans | 91.7 /100 | #125 | Exceptional $45,804 |
| Palestinians | 91.6 /100 | #126 | Exceptional $45,790 |
| Immigrants | Germany | 91.3 /100 | #127 | Exceptional $45,751 |
| Swedes | 91.3 /100 | #128 | Exceptional $45,750 |
| Luxembourgers | 90.4 /100 | #129 | Exceptional $45,663 |
| Arabs | 90.4 /100 | #130 | Exceptional $45,662 |
| Immigrants | North Macedonia | 90.0 /100 | #131 | Exceptional $45,622 |
Demographics Similar to Laotians by Per Capita Income
In terms of per capita income, the demographic groups most similar to Laotians are Immigrants from Pakistan ($47,084, a difference of 0.090%), Immigrants from Lebanon ($46,938, a difference of 0.22%), Immigrants from Uzbekistan ($46,929, a difference of 0.24%), Immigrants from Western Asia ($46,876, a difference of 0.35%), and Syrian ($46,837, a difference of 0.43%).
| Demographics | Rating | Rank | Per Capita Income |
| Immigrants | Moldova | 98.7 /100 | #92 | Exceptional $47,489 |
| Immigrants | Zimbabwe | 98.5 /100 | #93 | Exceptional $47,394 |
| Albanians | 98.5 /100 | #94 | Exceptional $47,379 |
| Immigrants | Egypt | 98.5 /100 | #95 | Exceptional $47,361 |
| Alsatians | 98.3 /100 | #96 | Exceptional $47,284 |
| Carpatho Rusyns | 98.2 /100 | #97 | Exceptional $47,248 |
| Immigrants | Pakistan | 97.9 /100 | #98 | Exceptional $47,084 |
| Laotians | 97.8 /100 | #99 | Exceptional $47,041 |
| Immigrants | Lebanon | 97.5 /100 | #100 | Exceptional $46,938 |
| Immigrants | Uzbekistan | 97.5 /100 | #101 | Exceptional $46,929 |
| Immigrants | Western Asia | 97.4 /100 | #102 | Exceptional $46,876 |
| Syrians | 97.2 /100 | #103 | Exceptional $46,837 |
| Brazilians | 96.8 /100 | #104 | Exceptional $46,700 |
| British | 96.3 /100 | #105 | Exceptional $46,571 |
| Ethiopians | 96.3 /100 | #106 | Exceptional $46,569 |